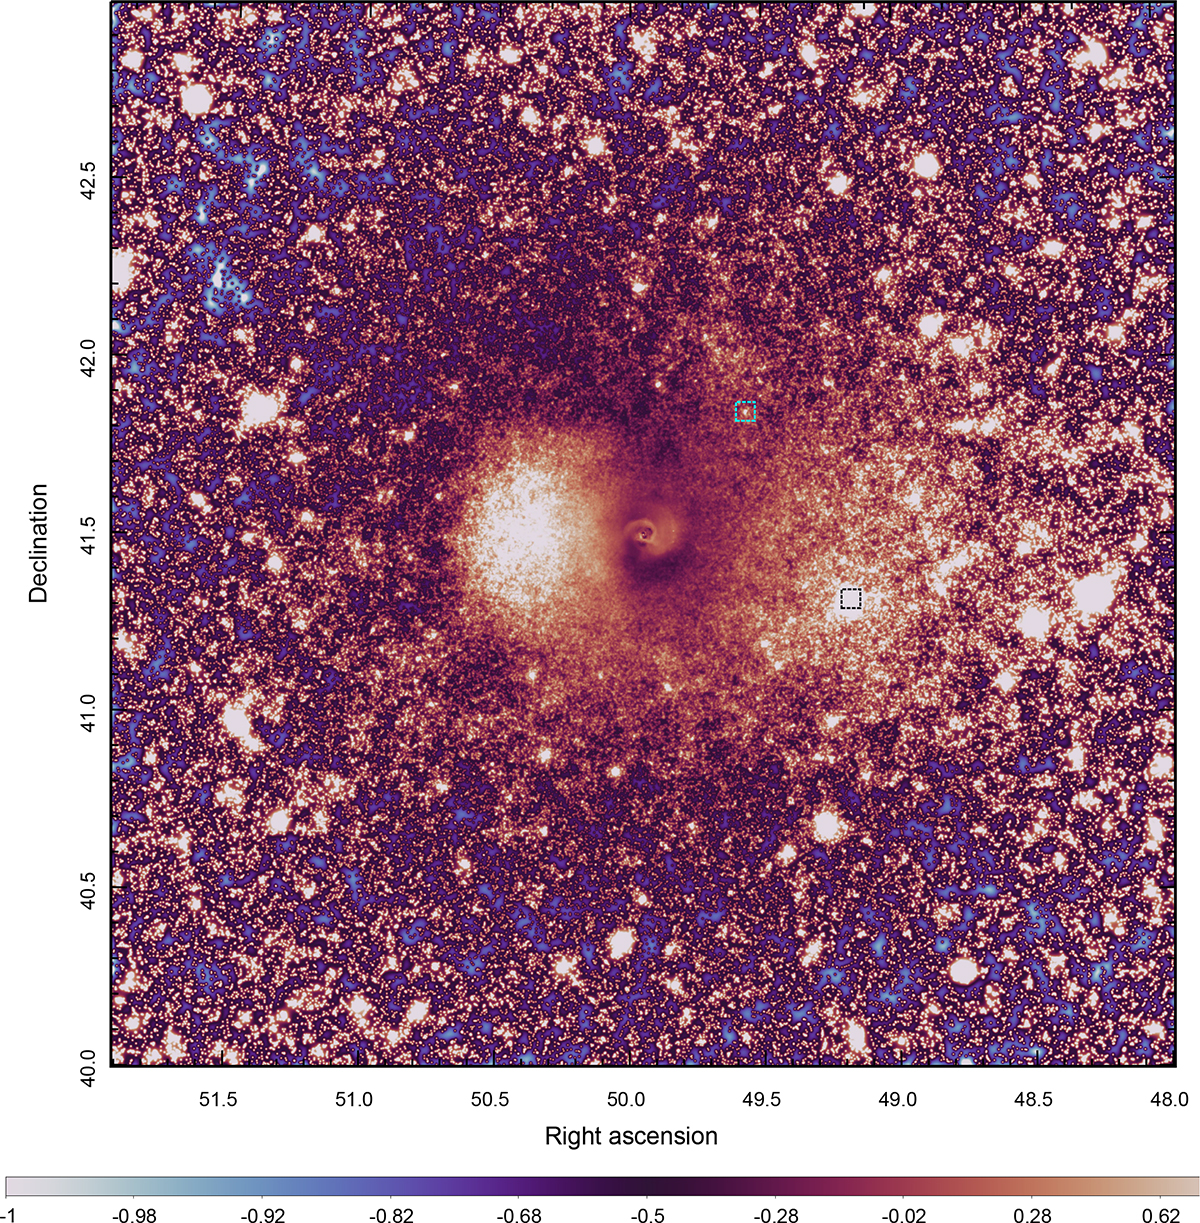
Fig. 4.
Download original image
Same image as in Fig. 3 after division by the best-fitting radial profile shown in Fig. C.1, specifically, (IX/Imodel−1), where the model is the sum of the best-fitting β-model and a constant sky background. In addition to the rich substructure in the core, this image shows clear signatures of an ongoing merger, including elongation in the east-west direction and sloshing. Two boxes show the positions of two prominent radio galaxies, IC310 (black) and NGC 1265 (cyan), respectively. (See also Fig. 6 for a smoothed version of the image that emphasizes large-scale structures.)
Current usage metrics show cumulative count of Article Views (full-text article views including HTML views, PDF and ePub downloads, according to the available data) and Abstracts Views on Vision4Press platform.
Data correspond to usage on the plateform after 2015. The current usage metrics is available 48-96 hours after online publication and is updated daily on week days.
Initial download of the metrics may take a while.