Fig. 12
Download original image
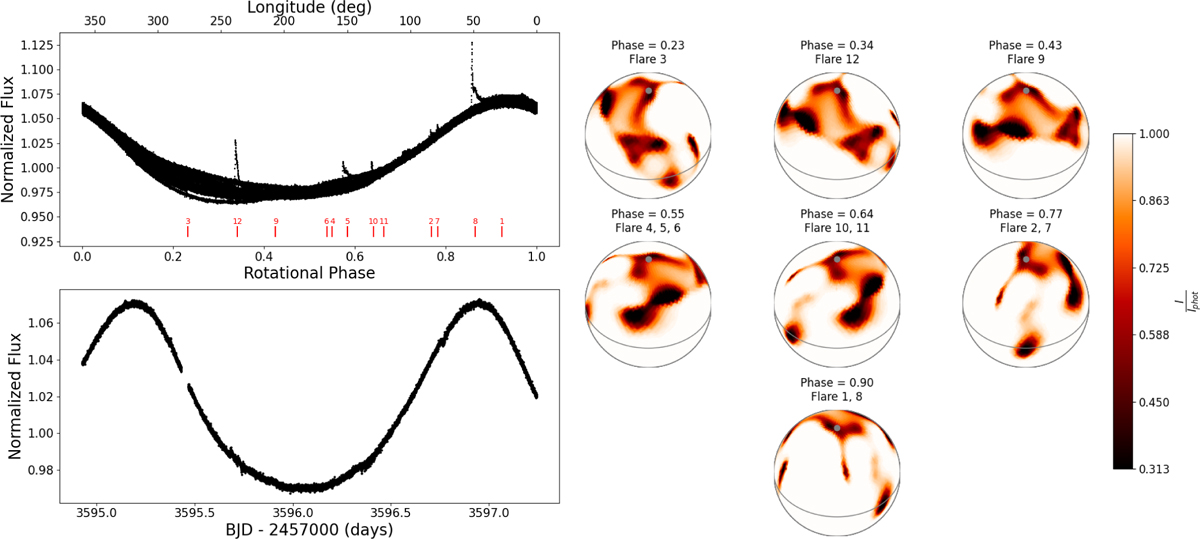
Upper left panel: TESS light curve of PW And from Sector 84, phase-folded over the stellar rotation period. The detected flares are marked by vertical red lines and numbered. Lower left panel: light curve covering the same time span as the spectroscopic data. Right panel: DI+LCI-reconstructed surface maps at the phases corresponding to each flare.
Current usage metrics show cumulative count of Article Views (full-text article views including HTML views, PDF and ePub downloads, according to the available data) and Abstracts Views on Vision4Press platform.
Data correspond to usage on the plateform after 2015. The current usage metrics is available 48-96 hours after online publication and is updated daily on week days.
Initial download of the metrics may take a while.