Fig. 4
Download original image
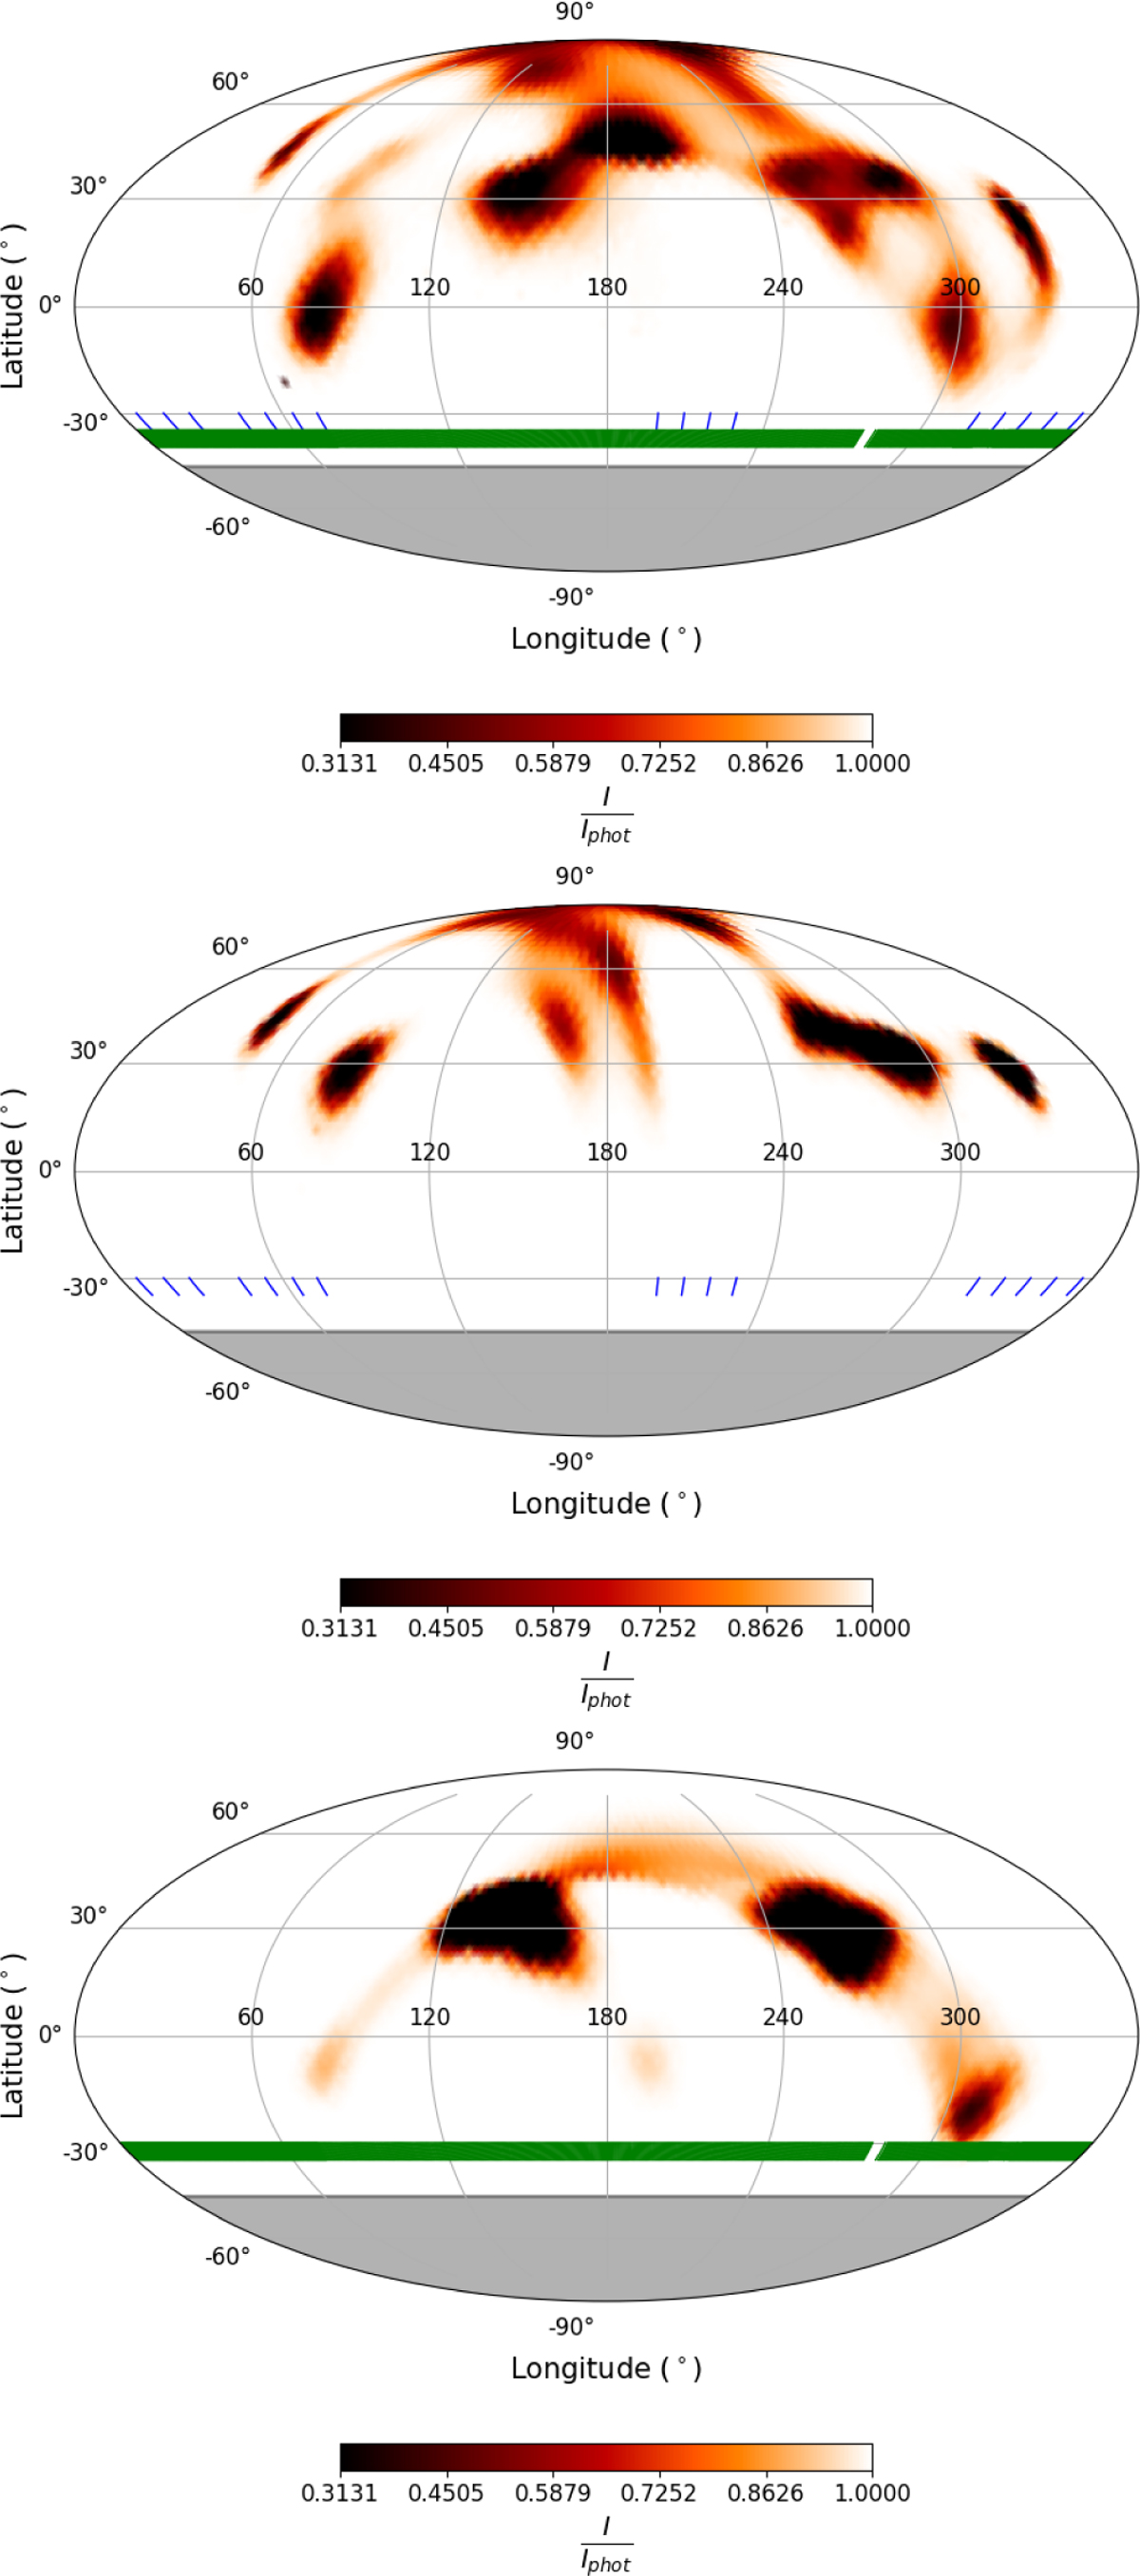
Surface brightness distribution maps in Mollweide projection obtained from the simultaneous reconstruction of the observed light curve and LSD profiles (upper panel), from LSD profiles only (middle panel), and from the light curve only (lower panel). The blue and green tick marks indicate the longitudinal positions covered by the spectral and photometric data, respectively, shown in terms of rotational phase (ℓ = 360 × (1−φ)). The gray-shaded region indicates the invisible part of the southern hemisphere owing to the axial inclination.
Current usage metrics show cumulative count of Article Views (full-text article views including HTML views, PDF and ePub downloads, according to the available data) and Abstracts Views on Vision4Press platform.
Data correspond to usage on the plateform after 2015. The current usage metrics is available 48-96 hours after online publication and is updated daily on week days.
Initial download of the metrics may take a while.