Fig. 5
Download original image
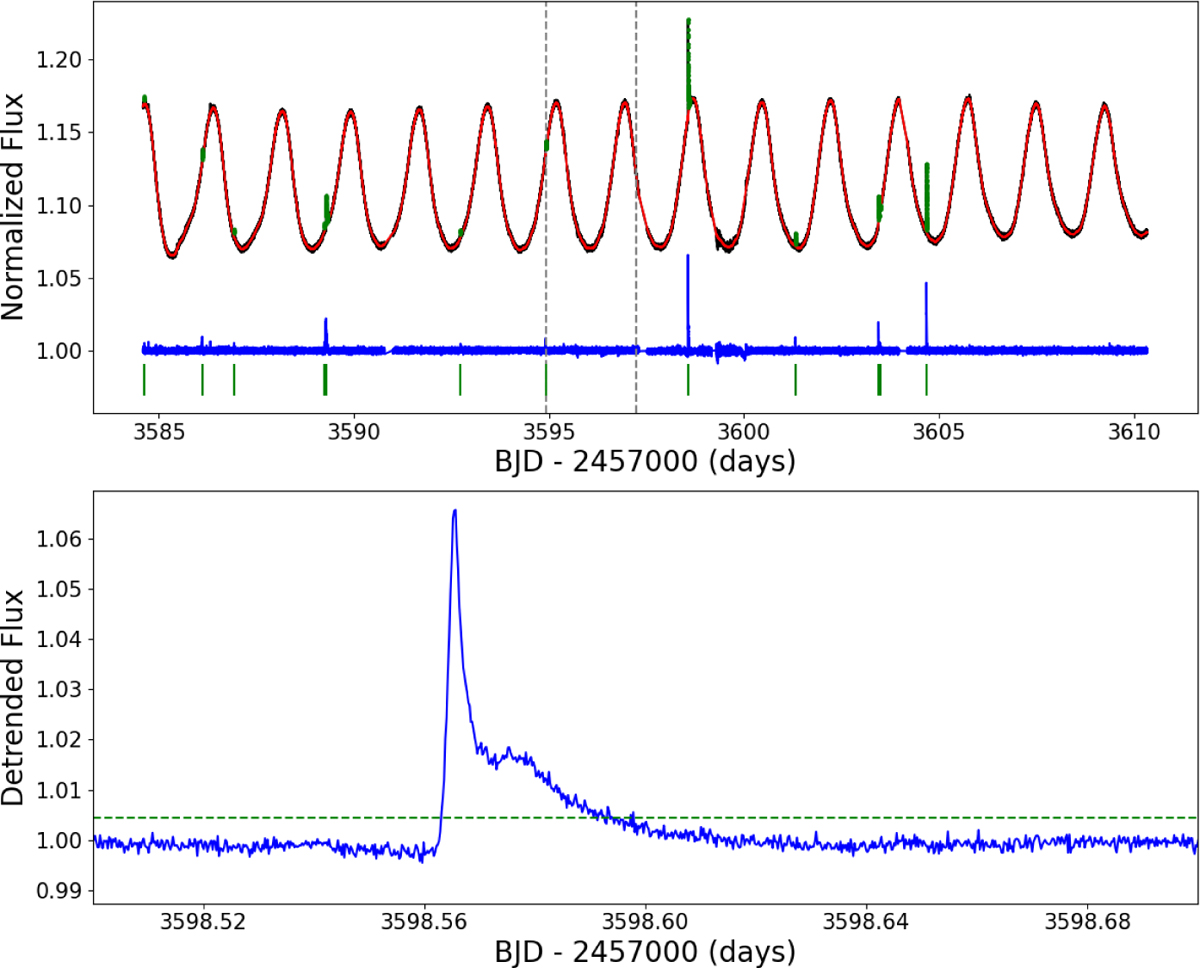
Upper panel: normalized TESS SAP flux light curve of PW And from Sector 84 (October 1−26, 2024). The detrended light curve is shown as the blue line, where flare signals remain, but spot-induced modulation and instrumental effects have been filtered out. The red line denotes the model used for this detrending. The gray dashed vertical lines indicate GAOES-RV observations contemporaneous with the TESS monitoring. Flares, defined as events in which at least four consecutive data points exceed the 3 σ threshold, are marked by green points. Each detected flare is also indicated by a vertical green bar beneath the light curve. Lower panel: close-up view of a representative detected flare. The green dashed line indicates the 3 σ threshold.
Current usage metrics show cumulative count of Article Views (full-text article views including HTML views, PDF and ePub downloads, according to the available data) and Abstracts Views on Vision4Press platform.
Data correspond to usage on the plateform after 2015. The current usage metrics is available 48-96 hours after online publication and is updated daily on week days.
Initial download of the metrics may take a while.