Open Access
Fig. 6
Download original image
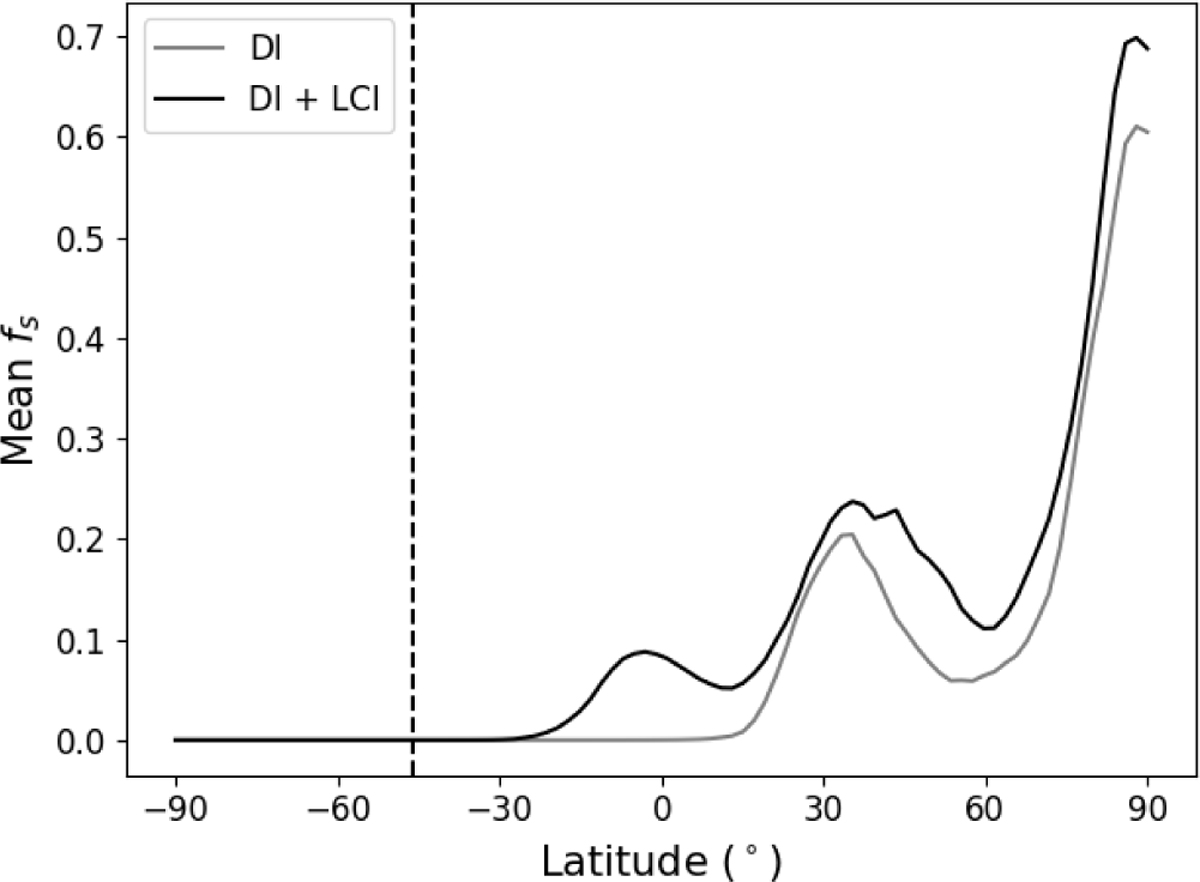
Latitudinal distribution of mean spot coverage. The gray and black solid lines correspond to the DI-only and the DI+LCI reconstruction, respectively. The dashed vertical line marks the latitude beyond which the stellar surface is not visible.
Current usage metrics show cumulative count of Article Views (full-text article views including HTML views, PDF and ePub downloads, according to the available data) and Abstracts Views on Vision4Press platform.
Data correspond to usage on the plateform after 2015. The current usage metrics is available 48-96 hours after online publication and is updated daily on week days.
Initial download of the metrics may take a while.