Open Access
Fig. 7
Download original image
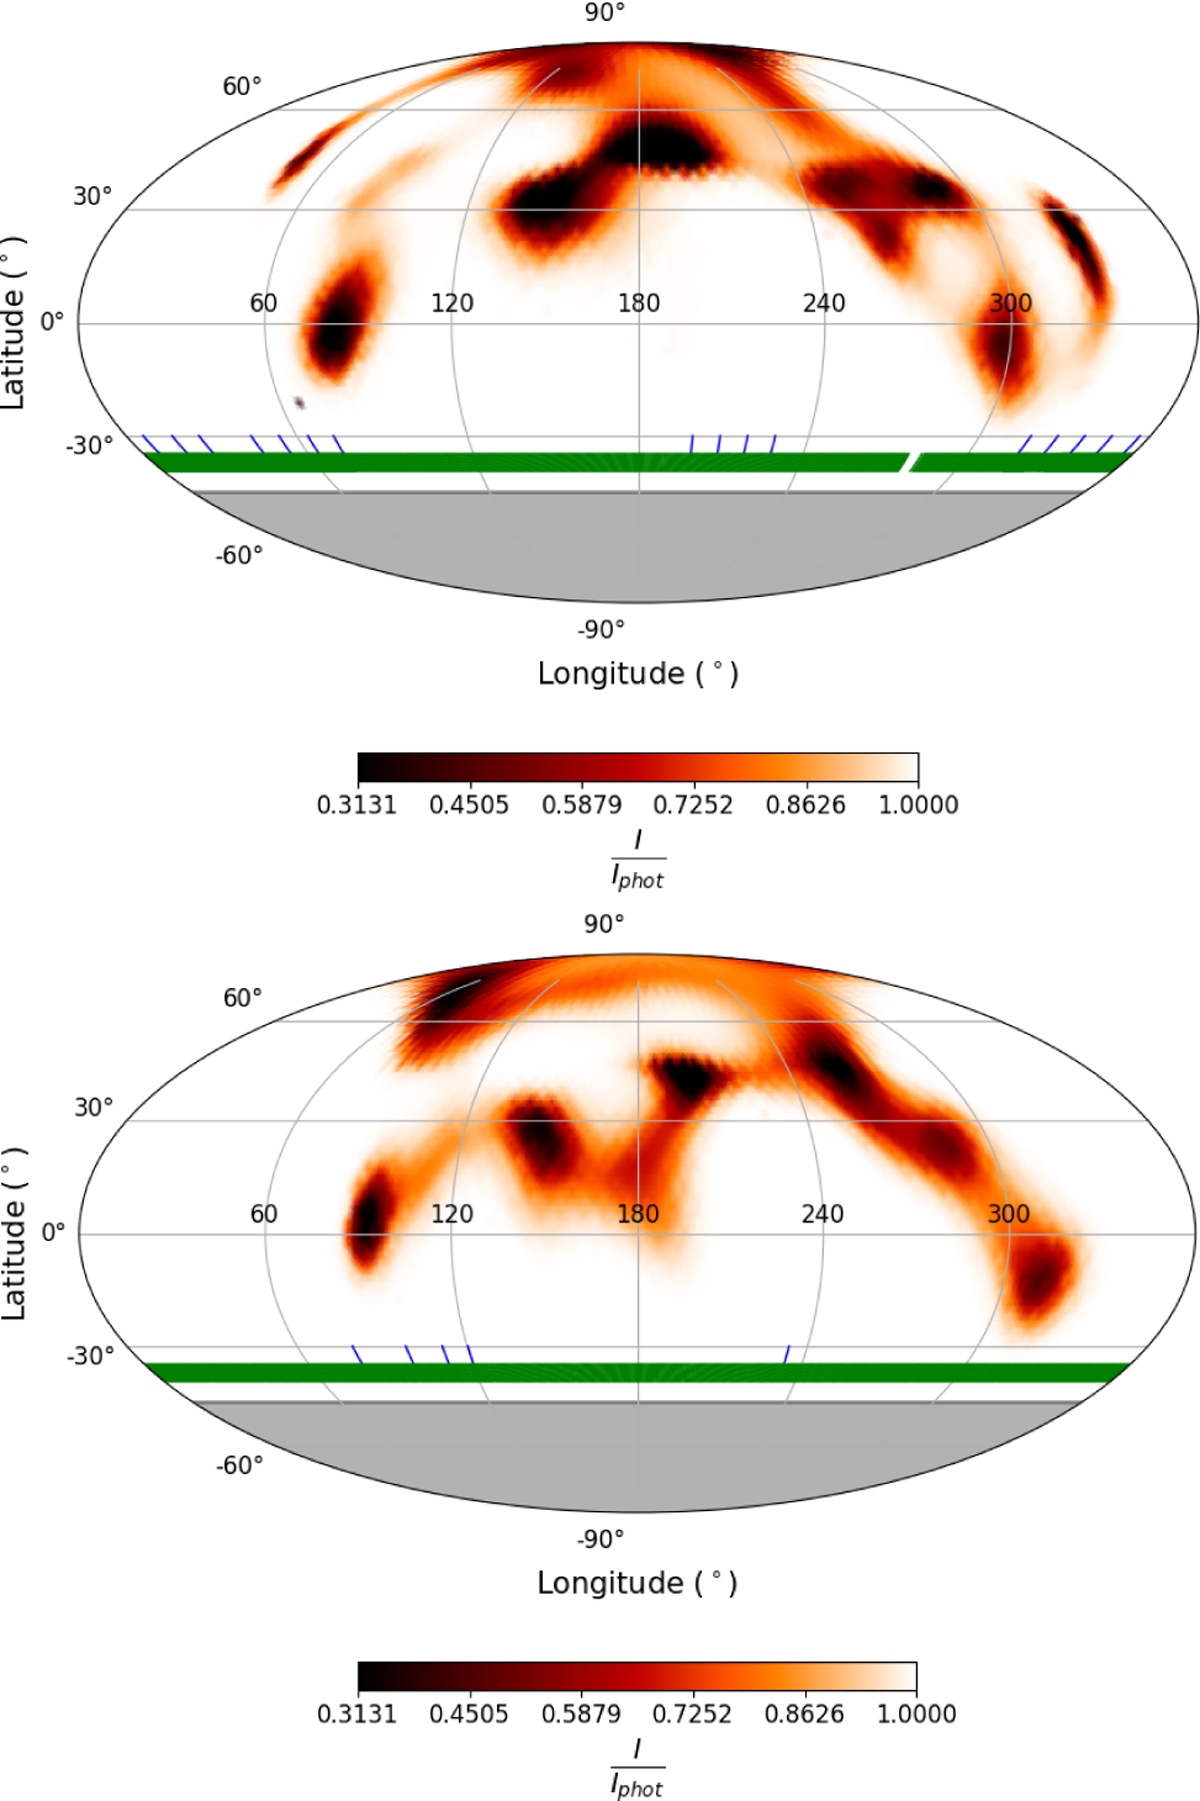
Surface brightness distribution maps in Mollweide projection obtained from the simultaneous reconstruction of the observed light curve and LSD profiles for the first (upper panel) and second (lower panel) dataset (for the description of the tick marks, see Fig. 4).
Current usage metrics show cumulative count of Article Views (full-text article views including HTML views, PDF and ePub downloads, according to the available data) and Abstracts Views on Vision4Press platform.
Data correspond to usage on the plateform after 2015. The current usage metrics is available 48-96 hours after online publication and is updated daily on week days.
Initial download of the metrics may take a while.