Fig. 8
Download original image
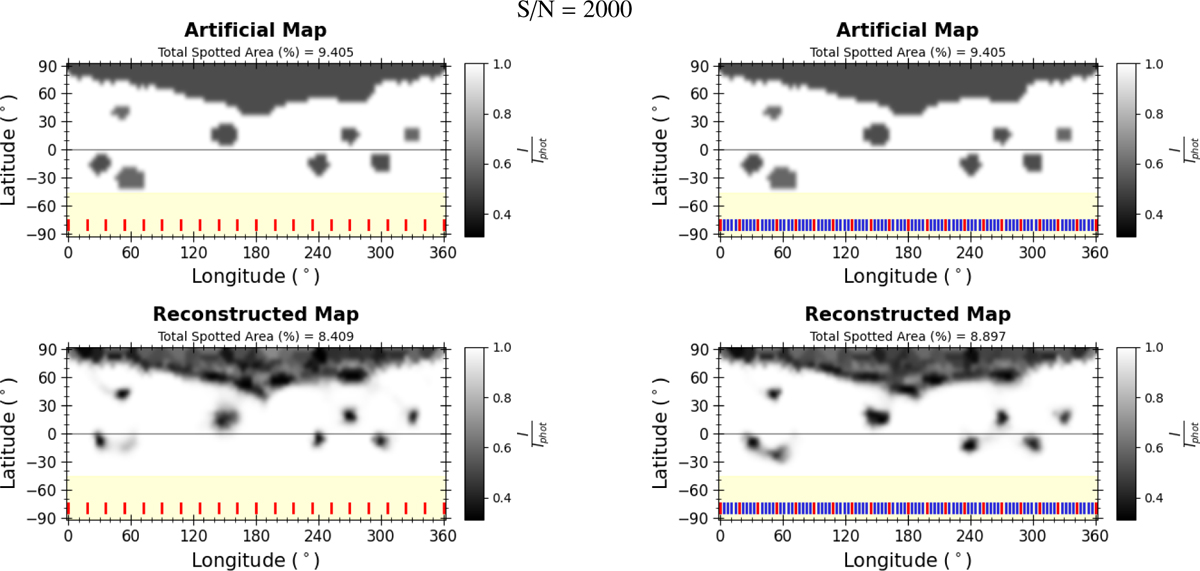
Reconstructed spot distribution maps obtained from DI-only (left panels) and combined DI+LCI (right panels) inversions (lower panels), based on the artificial input map (upper panels) under high S/N conditions and uniform phase sampling. The yellow-shaded region indicates the invisible part of the southern hemisphere, owing to the axial inclination. The red and blue tick marks show the phase coverage of spectral and photometric data, respectively.
Current usage metrics show cumulative count of Article Views (full-text article views including HTML views, PDF and ePub downloads, according to the available data) and Abstracts Views on Vision4Press platform.
Data correspond to usage on the plateform after 2015. The current usage metrics is available 48-96 hours after online publication and is updated daily on week days.
Initial download of the metrics may take a while.