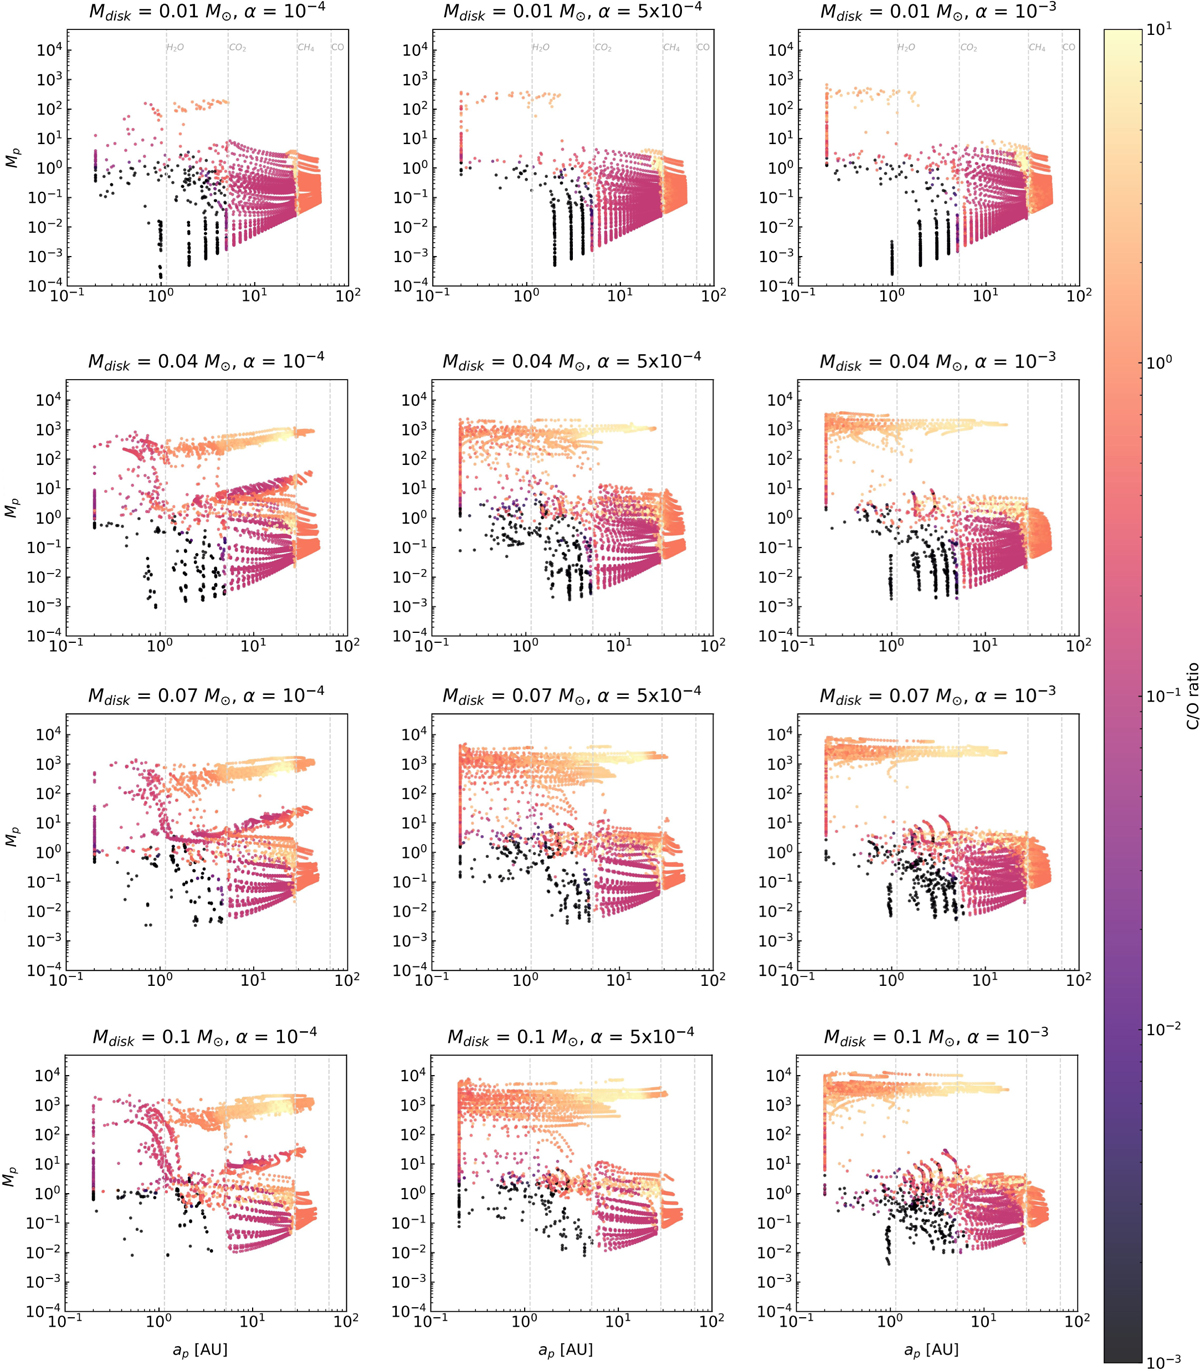
Fig. C.1
Download original image
Final planetary masses as a function of their final positions, colour coded by the atmospheric C/O ratio of the planets normalised to the stellar value. The different columns correspond to simulations with different viscosities, while the different rows show our probed initial disc masses. The vertical lines correspond to the position of the evaporation fronts of the major volatile carriers (H2O, CO2, CH4 and CO).
Current usage metrics show cumulative count of Article Views (full-text article views including HTML views, PDF and ePub downloads, according to the available data) and Abstracts Views on Vision4Press platform.
Data correspond to usage on the plateform after 2015. The current usage metrics is available 48-96 hours after online publication and is updated daily on week days.
Initial download of the metrics may take a while.