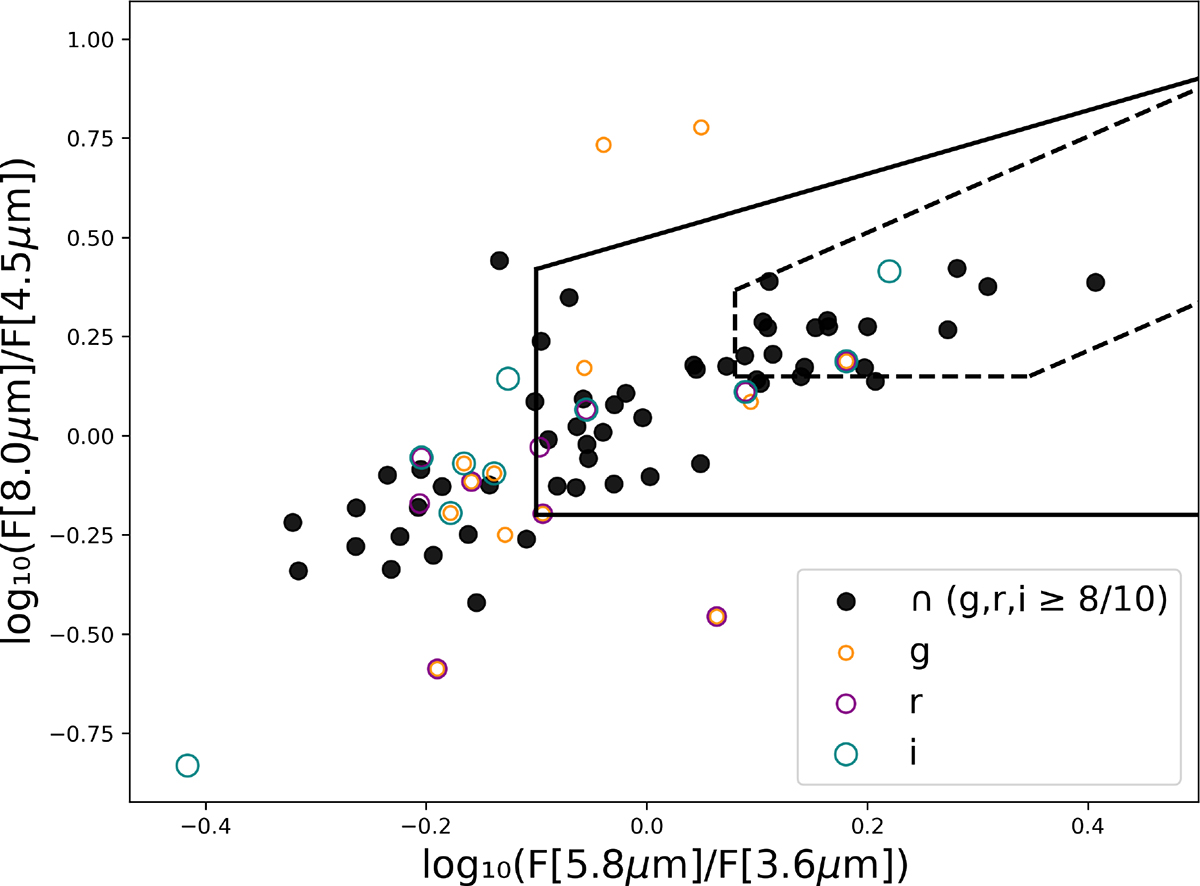
Fig. 1.
Download original image
Mid-infrared color-color diagram for our sample of 96 obscured AGN. The solid and dashed lines define the region where AGN are typically found after Lacy et al. (2007) and Donley et al. (2012), respectively. Filled black dots indicate sources that were classified as AGN in all three bands with an 8/10 threshold, while empty circles indicate sources classified as AGN in one or two bands only (using the same 8/10 threshold in each band), according to the legend in the figure.
Current usage metrics show cumulative count of Article Views (full-text article views including HTML views, PDF and ePub downloads, according to the available data) and Abstracts Views on Vision4Press platform.
Data correspond to usage on the plateform after 2015. The current usage metrics is available 48-96 hours after online publication and is updated daily on week days.
Initial download of the metrics may take a while.