Fig. 3.
Download original image
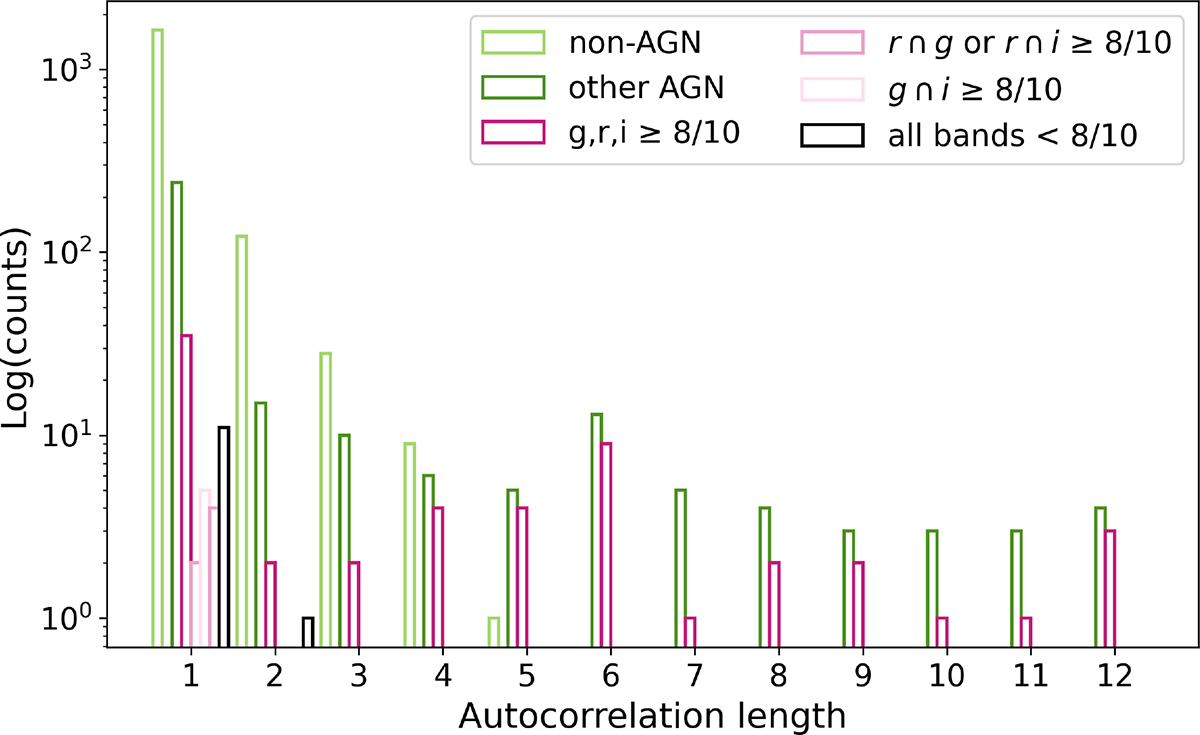
Distribution of the values obtained from the r-band light curves for the Autocor_length feature. The AGN in the LS are split into obscured AGN confirmed in all three bands (deep magenta), in the r band plus either g or i (light magenta), or in the g and i bands, but not in the r (light pink). Dark green indicates all the other AGN, meaning all the AGN in the LS that are not labeled as obscured, while the non-AGN are shown in light green. Black represents the obscured AGN that each classifier consistently failed to identify (that is to say, they were classified as AGN in < 8/10 experiments per band).
Current usage metrics show cumulative count of Article Views (full-text article views including HTML views, PDF and ePub downloads, according to the available data) and Abstracts Views on Vision4Press platform.
Data correspond to usage on the plateform after 2015. The current usage metrics is available 48-96 hours after online publication and is updated daily on week days.
Initial download of the metrics may take a while.