Fig. 4.
Download original image
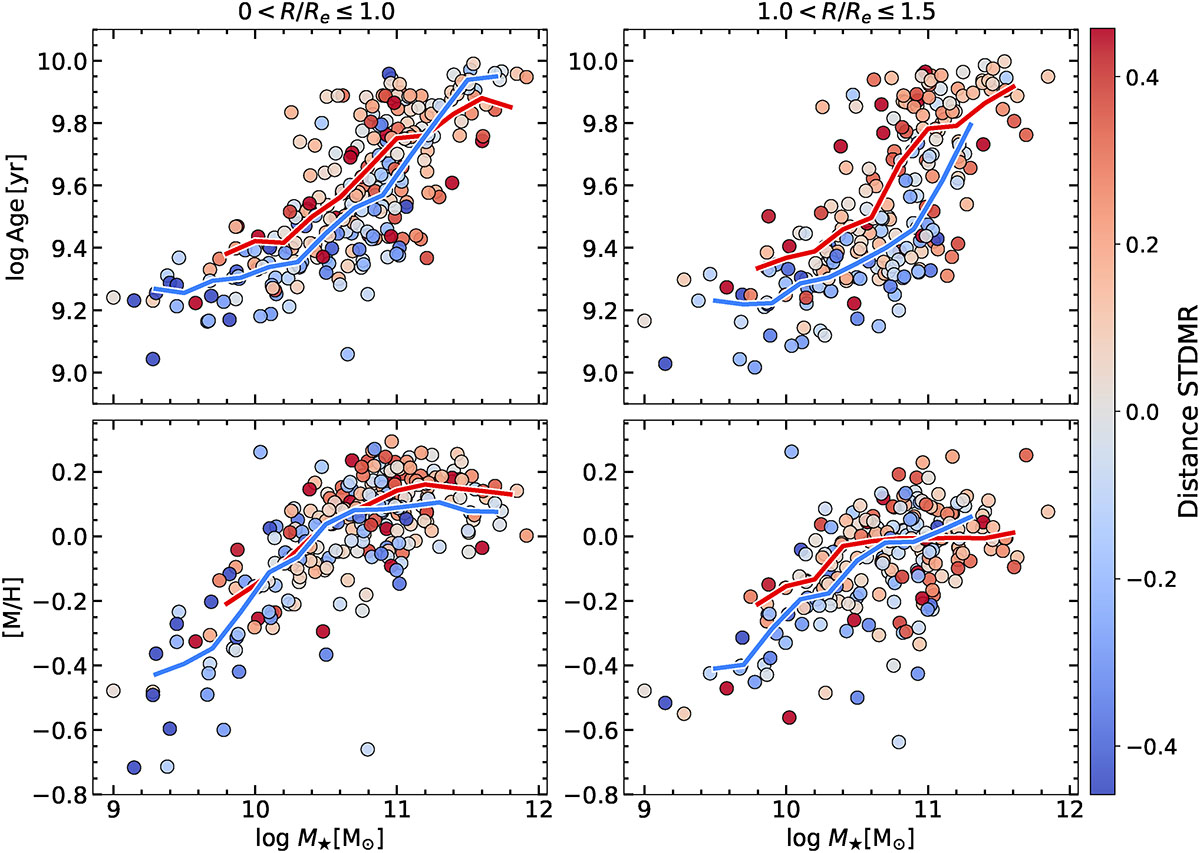
Scaling relations between age/[M/H] and stellar mass for galaxies with different positions with respect to mean STDMR. Scaling relations with age are shown in the upper panels and the ones with [M/H] are given in the bottom ones. Ages and [M/H] are measured within the inner (r/Re ≤ 1) and within outer regions (1 < r/Re ≤ 1.5) of the galaxies (left and right panels, respectively). For individual galaxies, median ages and [M/H] (computed within the corresponding annuli) are plotted as a function of stellar mass color-coded by their vertical offset with respect to the mean STDMR (in the STDMR plane). Median ages and [M/H] of the galaxies above and below the STDMR (see Fig. 3) are indicated with solid lines: red for galaxies above the mean STDMR and blue for the ones below.
Current usage metrics show cumulative count of Article Views (full-text article views including HTML views, PDF and ePub downloads, according to the available data) and Abstracts Views on Vision4Press platform.
Data correspond to usage on the plateform after 2015. The current usage metrics is available 48-96 hours after online publication and is updated daily on week days.
Initial download of the metrics may take a while.