Fig. 6.
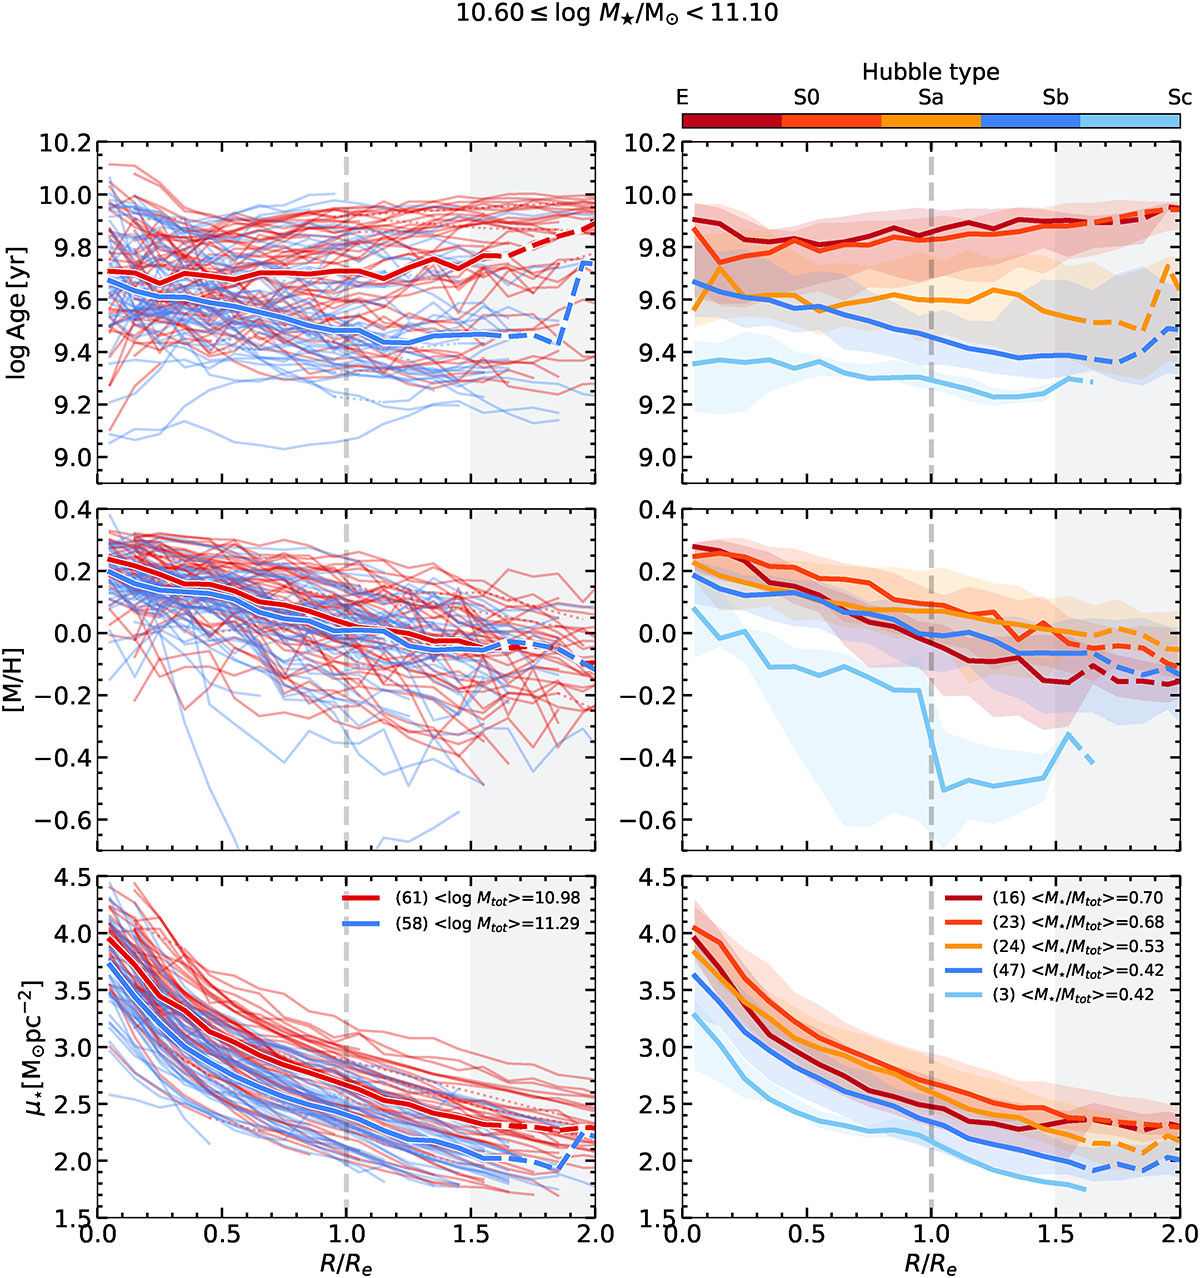
Download original image
Dependence on total mass and morphology of stellar population profiles in narrow stellar mass bin, log M★/M⊙ ϵ (10.6, 11.1]. Age (upper panels), [M/H] (middle panels), and μ★ (bottom panels) profiles are plotted as a function of galactocentric distance. Left column: Dependence on total mass. Profiles of individual galaxies are indicated with dashed lines color-coded according to their position with respect to the mean STDMR (red for galaxies above the mean relation, and blue for the ones below it). Median profiles of galaxies above and below the mean STDMR are shown as red and blue solid lines, respectively. By construction, galaxies above the relation (red) have lower total masses than galaxies below (blue). The caption indicates the median total mass and number of galaxies for both galaxy subsamples. Right column: Dependence on morphology. Median profiles of different morphological types are shown with different colors, and shaded regions indicate the 16th and 84th percentiles of the corresponding distributions. The caption indicates the median stellar-to-total mass of each galaxy subsample. For reference, 1 Re is indicated with a vertical dashed gray line in each panel.
Current usage metrics show cumulative count of Article Views (full-text article views including HTML views, PDF and ePub downloads, according to the available data) and Abstracts Views on Vision4Press platform.
Data correspond to usage on the plateform after 2015. The current usage metrics is available 48-96 hours after online publication and is updated daily on week days.
Initial download of the metrics may take a while.