Open Access
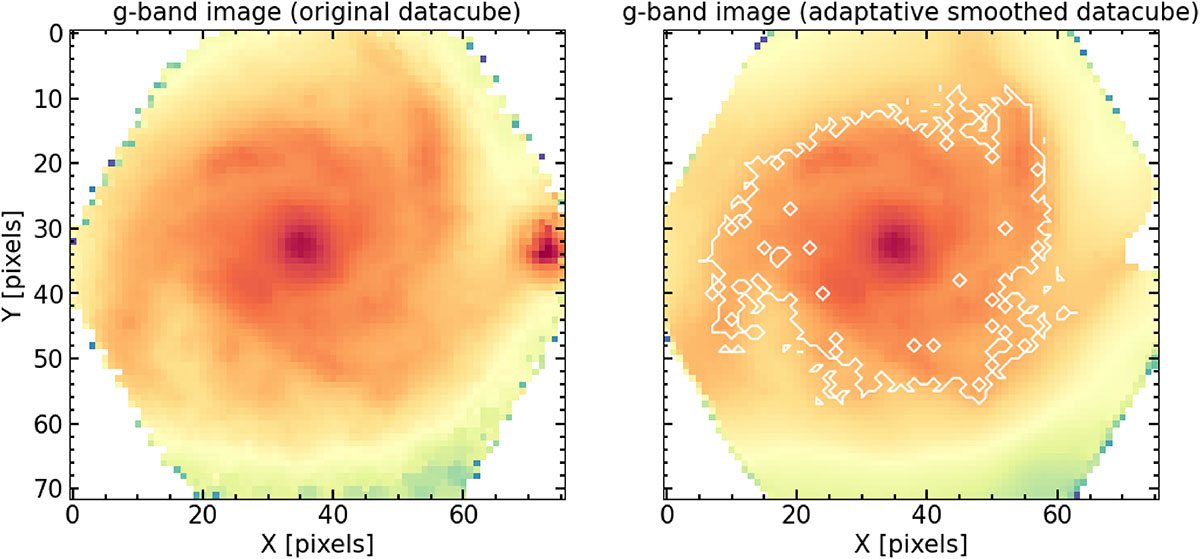
Fig. A.1.
Download original image
Synthesized g-band images of NGC0234 derived from both the original datacube (left panel) and after applying the adaptive smoothing to the datacube (right panel). The white contours in the left panel indicate the region in which no smoothing is applied due to the higher S/N, i.e., effectively the central region.
Current usage metrics show cumulative count of Article Views (full-text article views including HTML views, PDF and ePub downloads, according to the available data) and Abstracts Views on Vision4Press platform.
Data correspond to usage on the plateform after 2015. The current usage metrics is available 48-96 hours after online publication and is updated daily on week days.
Initial download of the metrics may take a while.