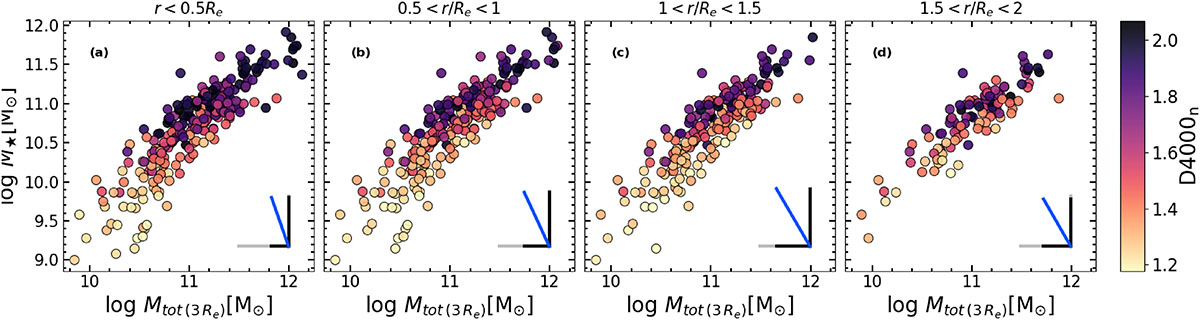
Fig. B.1.
Download original image
Stellar-to-total dynamical mass relation for our CALIFA galaxies in terms of the age-sensitive D4000n break measured at different annuli. Each panel corresponds to a different annuli with increasing galactocentric distance from left to right (see text). Galaxies are shown as circles colored-coded by the median D4000n measured within their corresponding annuli. Partial correlation coefficient strengths are shown in the bottom right corner (solid black lines) between the D4000n and M★ (vertical) and Mtot (horizontal). Grey solid lines have a length which corresponds to a correlation coefficient of 0.6 for reference. The direction of maximal increase of the stellar population parameters (see text) is indicated as a blue solid line.
Current usage metrics show cumulative count of Article Views (full-text article views including HTML views, PDF and ePub downloads, according to the available data) and Abstracts Views on Vision4Press platform.
Data correspond to usage on the plateform after 2015. The current usage metrics is available 48-96 hours after online publication and is updated daily on week days.
Initial download of the metrics may take a while.