Open Access
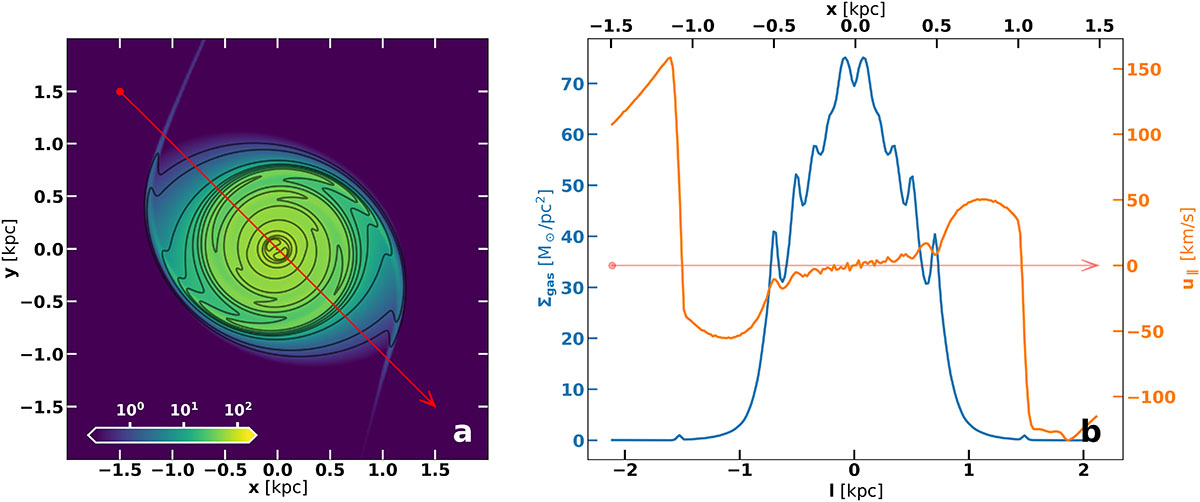
Fig. 16.
Download original image
Model R901: Variation in gas surface density (Σ) and the velocity component along a defined slit (u∥) for cs = 20 km s−1. Panel (a) shows the slit’s location, while panel (b) presents the variations, with the blue curve indicating Σ and the orange curve representing u∥. The labels on the axes are the same as in Fig. 6.
Current usage metrics show cumulative count of Article Views (full-text article views including HTML views, PDF and ePub downloads, according to the available data) and Abstracts Views on Vision4Press platform.
Data correspond to usage on the plateform after 2015. The current usage metrics is available 48-96 hours after online publication and is updated daily on week days.
Initial download of the metrics may take a while.