Open Access
Fig. 2.
Download original image
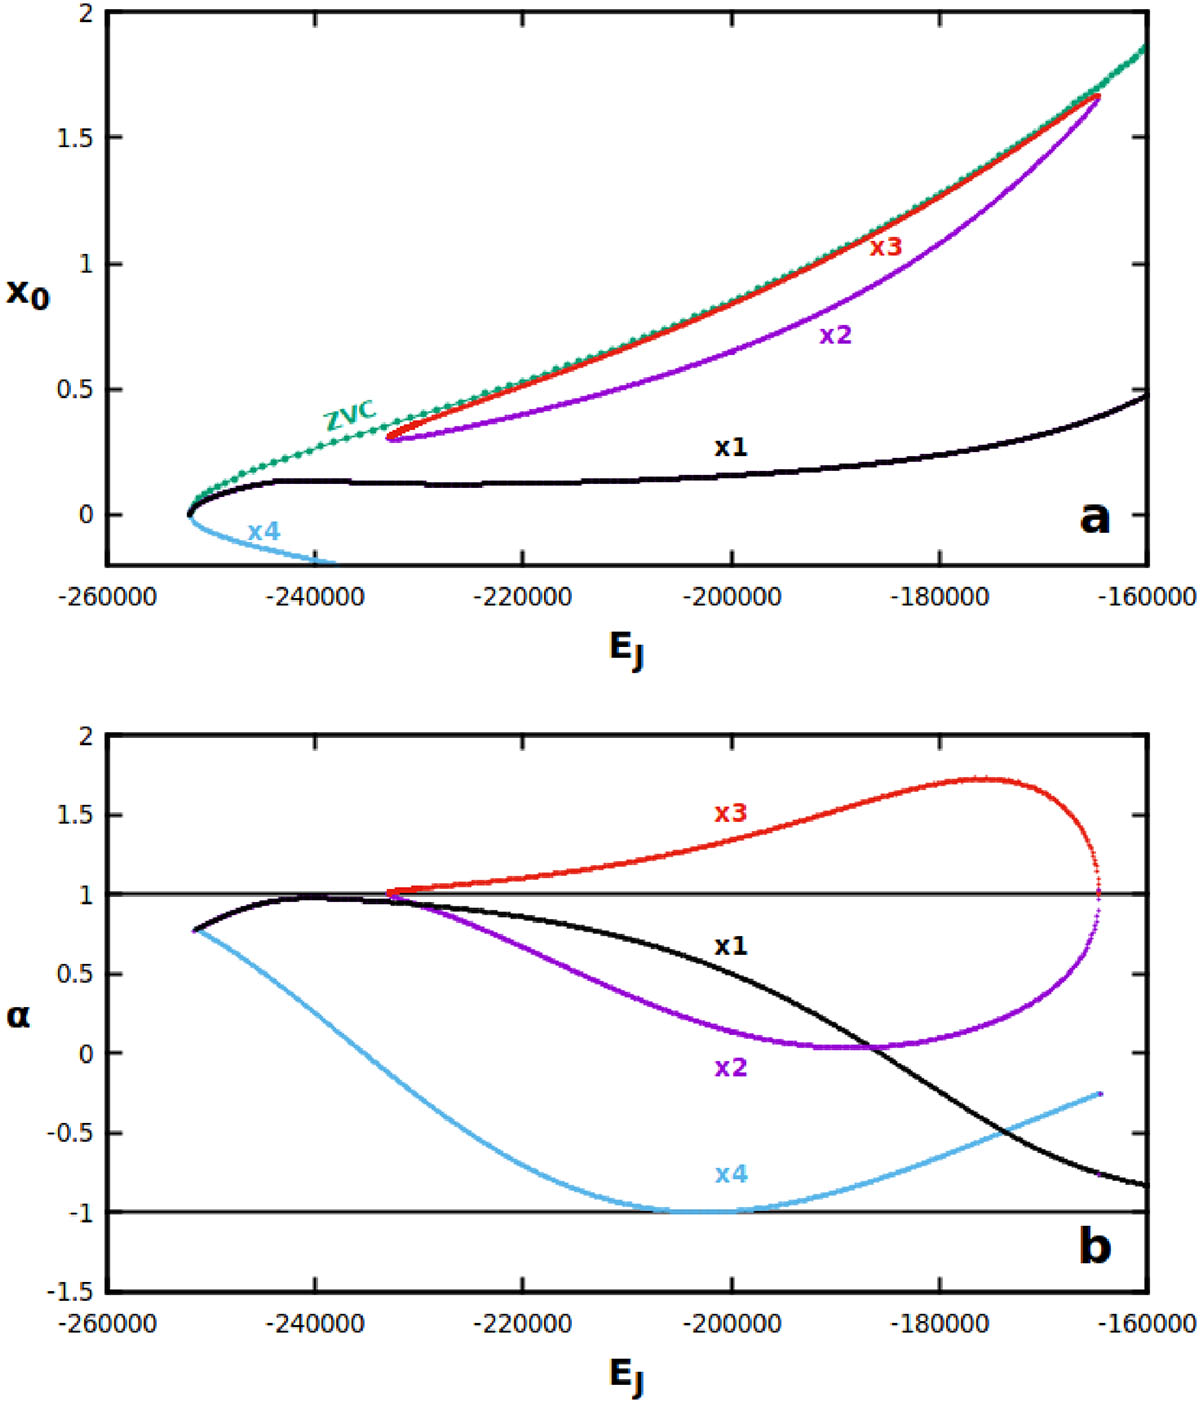
Model R001: (a) Characteristic diagrams for the x1, x2 and x4 families. The zero velocity curve is depicted with a green color and indicated with “ZVC.” (b) Hénon index, α, for the same families. We find no changes in the stability of any of these families.
Current usage metrics show cumulative count of Article Views (full-text article views including HTML views, PDF and ePub downloads, according to the available data) and Abstracts Views on Vision4Press platform.
Data correspond to usage on the plateform after 2015. The current usage metrics is available 48-96 hours after online publication and is updated daily on week days.
Initial download of the metrics may take a while.