Fig. 23.
Download original image
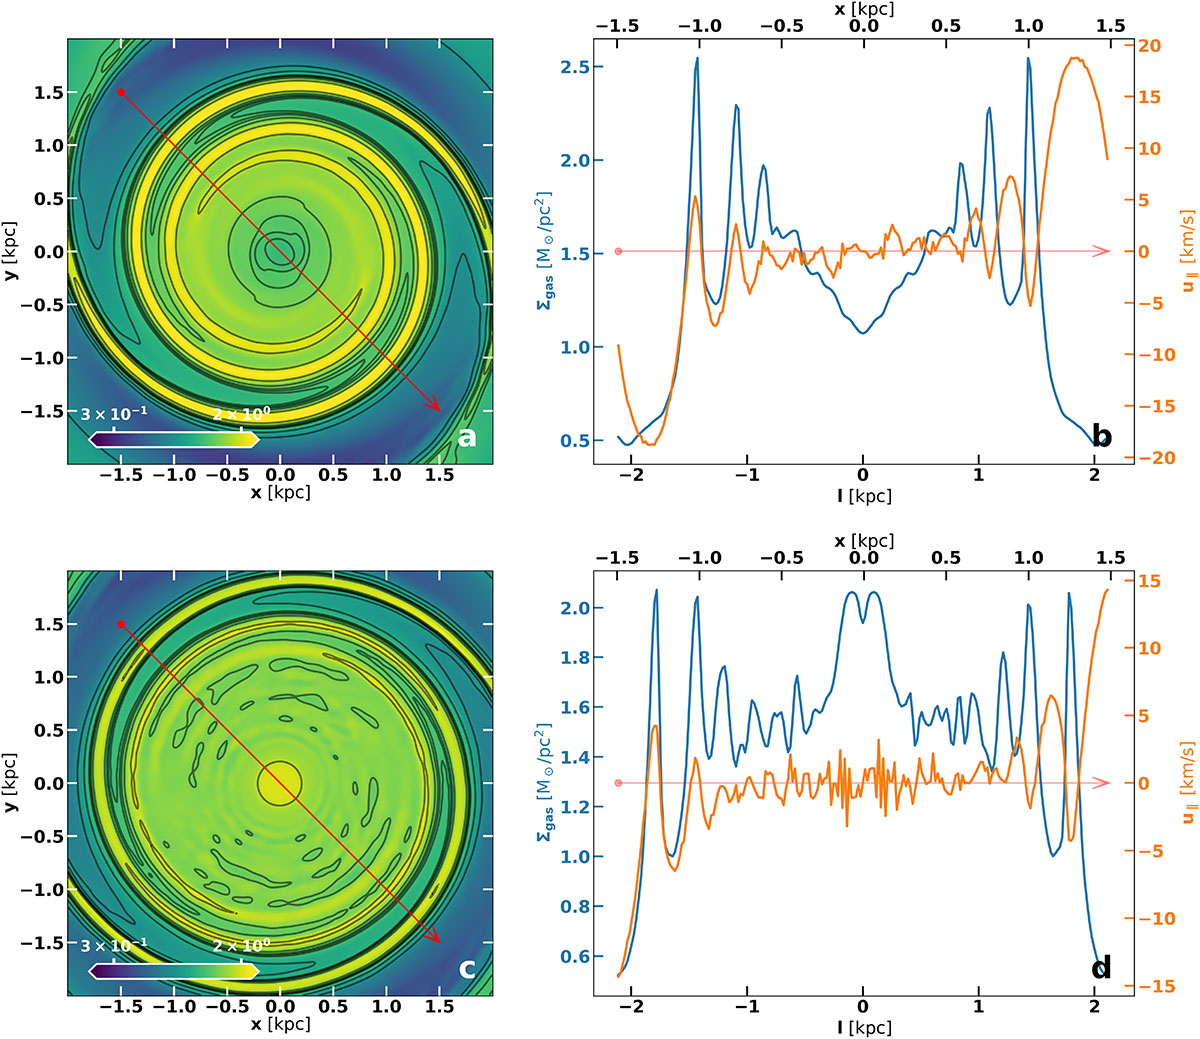
(a) and (b): Variation in gas surface density (Σ) and the velocity component along a defined slit (u∥) for model R801 with cs = 10 km s−1. (c) and (d) Same figures for model R991. We find that if a high surface density is initially set at the center (R991), it persists throughout the simulation; without it (R801), the central density remains low, lower than that of its surroundings, as in the case with the full potential.
Current usage metrics show cumulative count of Article Views (full-text article views including HTML views, PDF and ePub downloads, according to the available data) and Abstracts Views on Vision4Press platform.
Data correspond to usage on the plateform after 2015. The current usage metrics is available 48-96 hours after online publication and is updated daily on week days.
Initial download of the metrics may take a while.