Fig. 14
Download original image
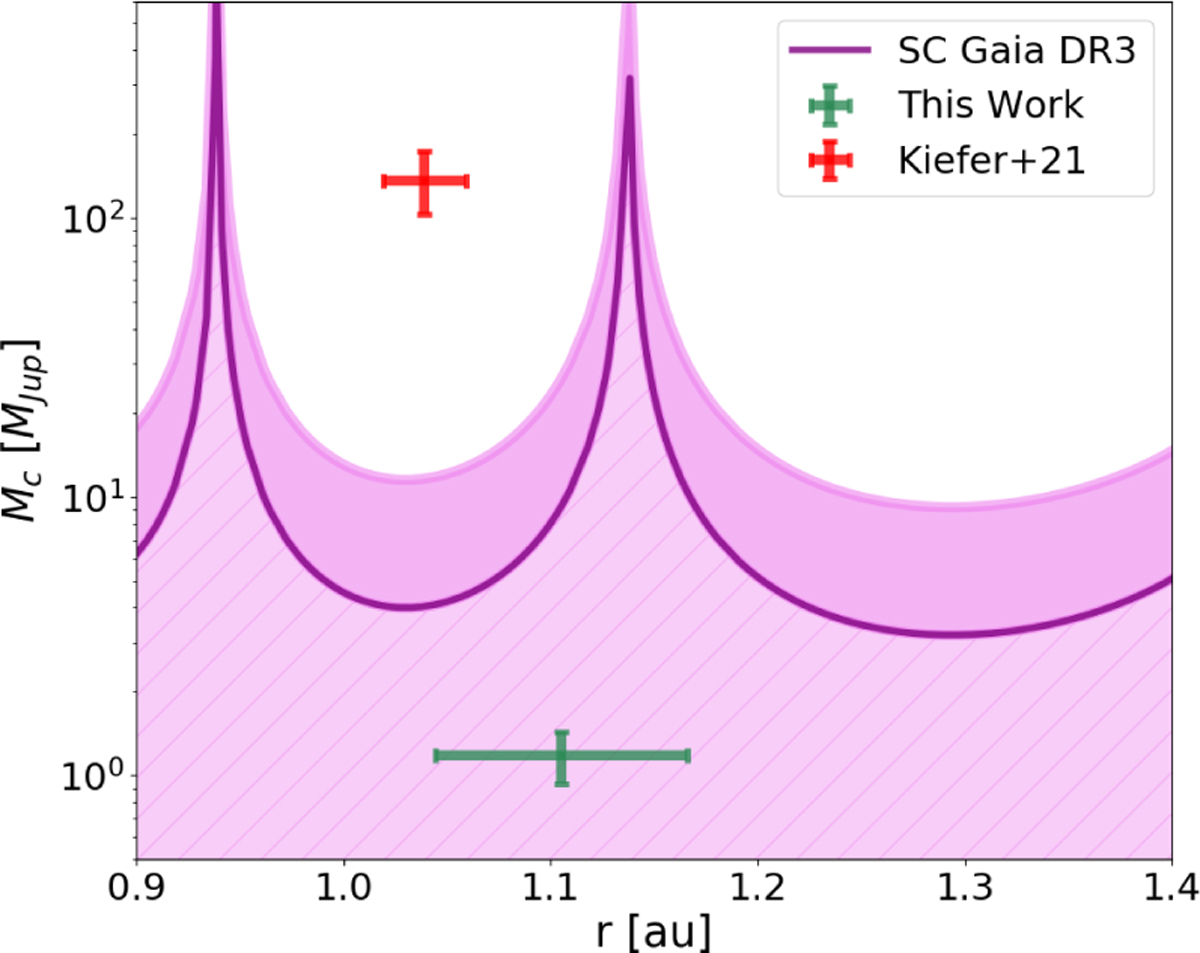
Sensitivity curve for HD 148427 companion. The red cross represents the value obtained by Kiefer et al. (2021) using GASTON; the green cross is the value we obtained with GDR3 in this work. Our result is below the sensitivity curve. Since the error of ΔνT is bigger than the value itself, for construction, we cannot represent it because it would show a negative mass. With the hatched area we represent the positive values.
Current usage metrics show cumulative count of Article Views (full-text article views including HTML views, PDF and ePub downloads, according to the available data) and Abstracts Views on Vision4Press platform.
Data correspond to usage on the plateform after 2015. The current usage metrics is available 48-96 hours after online publication and is updated daily on week days.
Initial download of the metrics may take a while.