Open Access
Fig. 2
Download original image
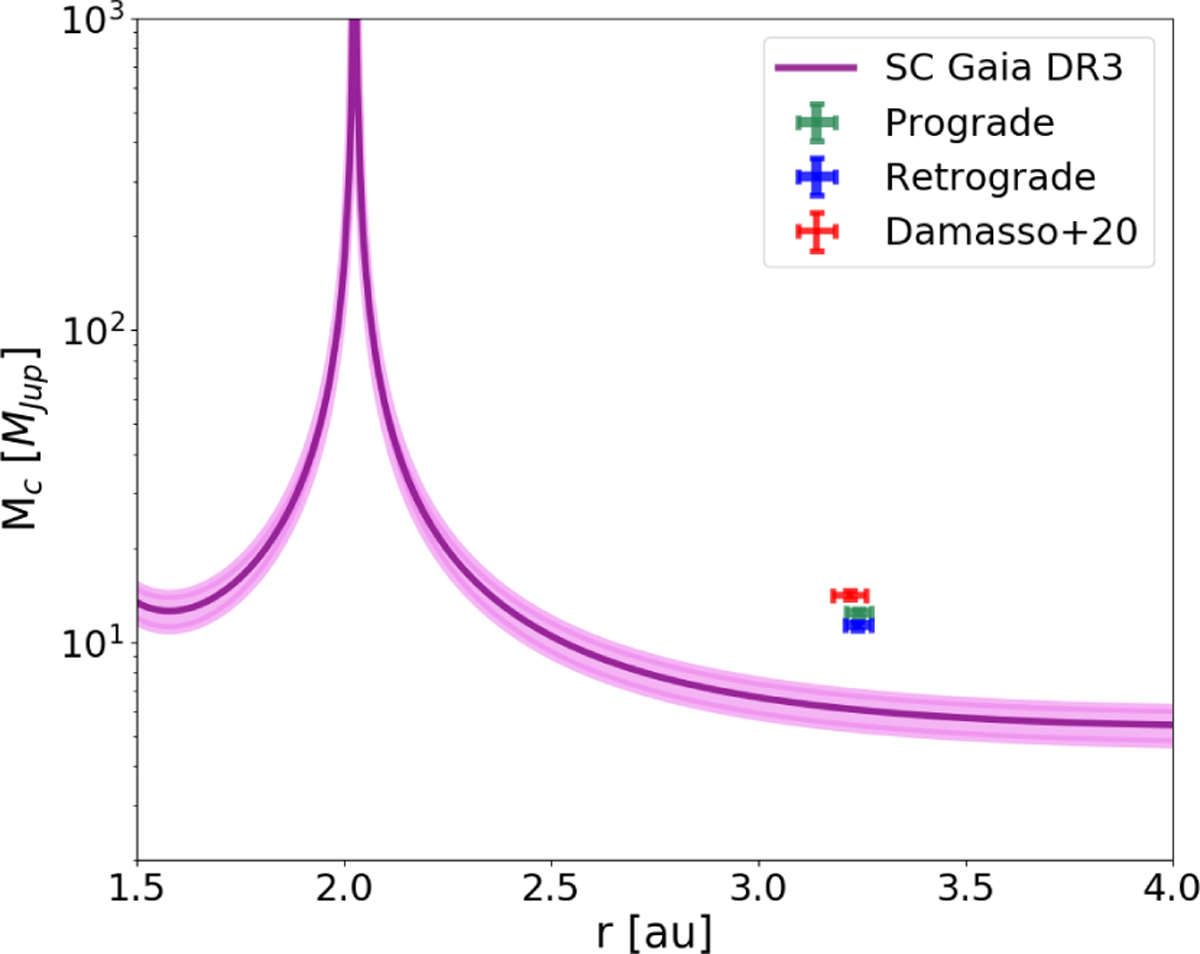
Sensitivity curve for π Men companion. The red cross represents the value obtained by Damasso et al. (2020) using GDR2; the green and the blue crosses are the results we obtained with GDR3 in this work for the prograde and the retrograde solutions, respectively. The values stay over the sensitivity curve.
Current usage metrics show cumulative count of Article Views (full-text article views including HTML views, PDF and ePub downloads, according to the available data) and Abstracts Views on Vision4Press platform.
Data correspond to usage on the plateform after 2015. The current usage metrics is available 48-96 hours after online publication and is updated daily on week days.
Initial download of the metrics may take a while.