Fig. 2
Download original image
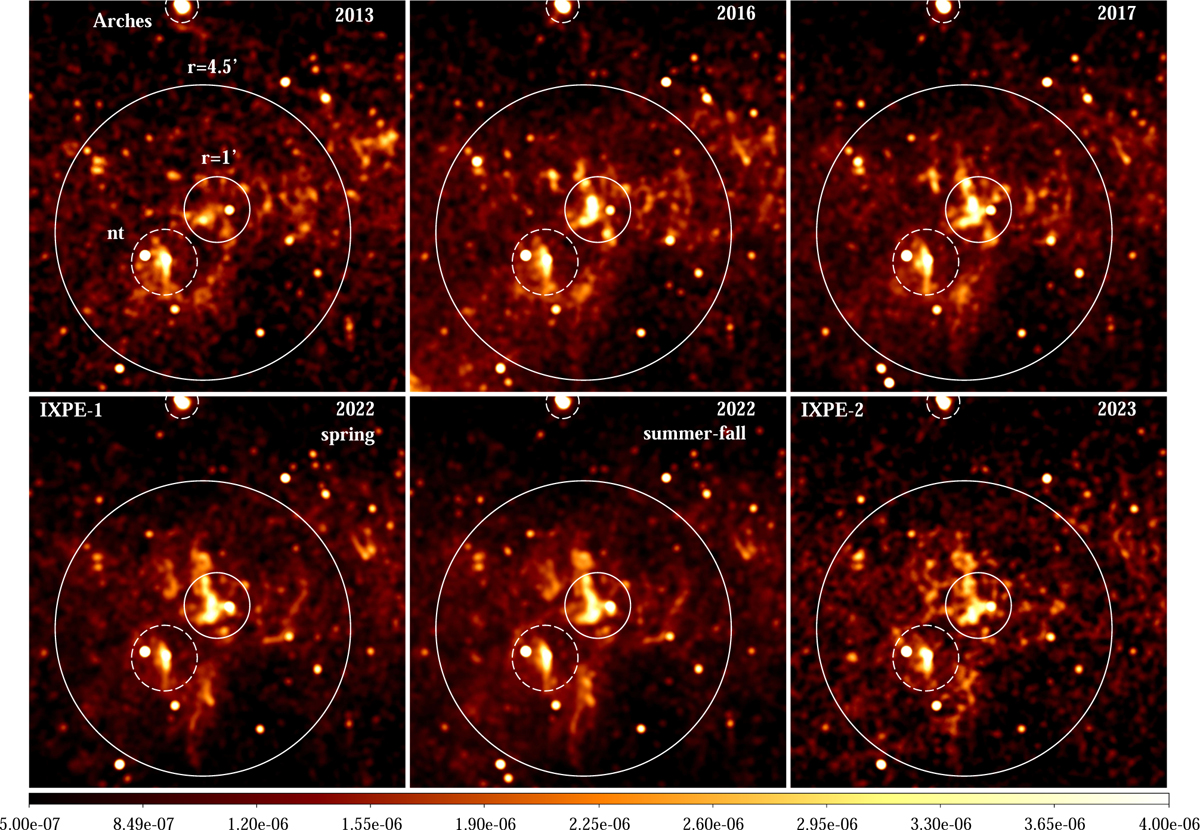
Chandra images of the Sgr A complex in the 3–8 keV band taken at different epochs starting from 2013 to 2023. The images have been smoothed with a σ = 5″ Gaussian to highlight the morphology of the diffuse emission (ct s−1 pixel−1, linear scale, Galactic coordinates). The epochs marked as IXPE-1 and IXPE-2 most closely correspond to the two epochs of IXPE observations in 2022 and 2023. The large circle has a 4.5′ radius and was used in Paper I for the extraction of the polarization signal after masking the region around the pulsar and related nonthermal nebula G0.13-0.11 (marked with “nt” and a dashed circle of 1′ radius). The brightest region of the Sgr A complex is marked with a small solid circle (“r = 1′,” also 1′ radius). The location of the Arches cluster is also marked in the top part of the image. Clear time variations of the diffuse emission are visible, indicating regions likely dominated by the reflected emission (the data from 2013 and 2023 have lower exposure, resulting in enhanced photon-counting noise fluctuations). Sgr A* lies outside the region shown, at a few arc minutes from the right boundary.
Current usage metrics show cumulative count of Article Views (full-text article views including HTML views, PDF and ePub downloads, according to the available data) and Abstracts Views on Vision4Press platform.
Data correspond to usage on the plateform after 2015. The current usage metrics is available 48-96 hours after online publication and is updated daily on week days.
Initial download of the metrics may take a while.