Fig. 3
Download original image
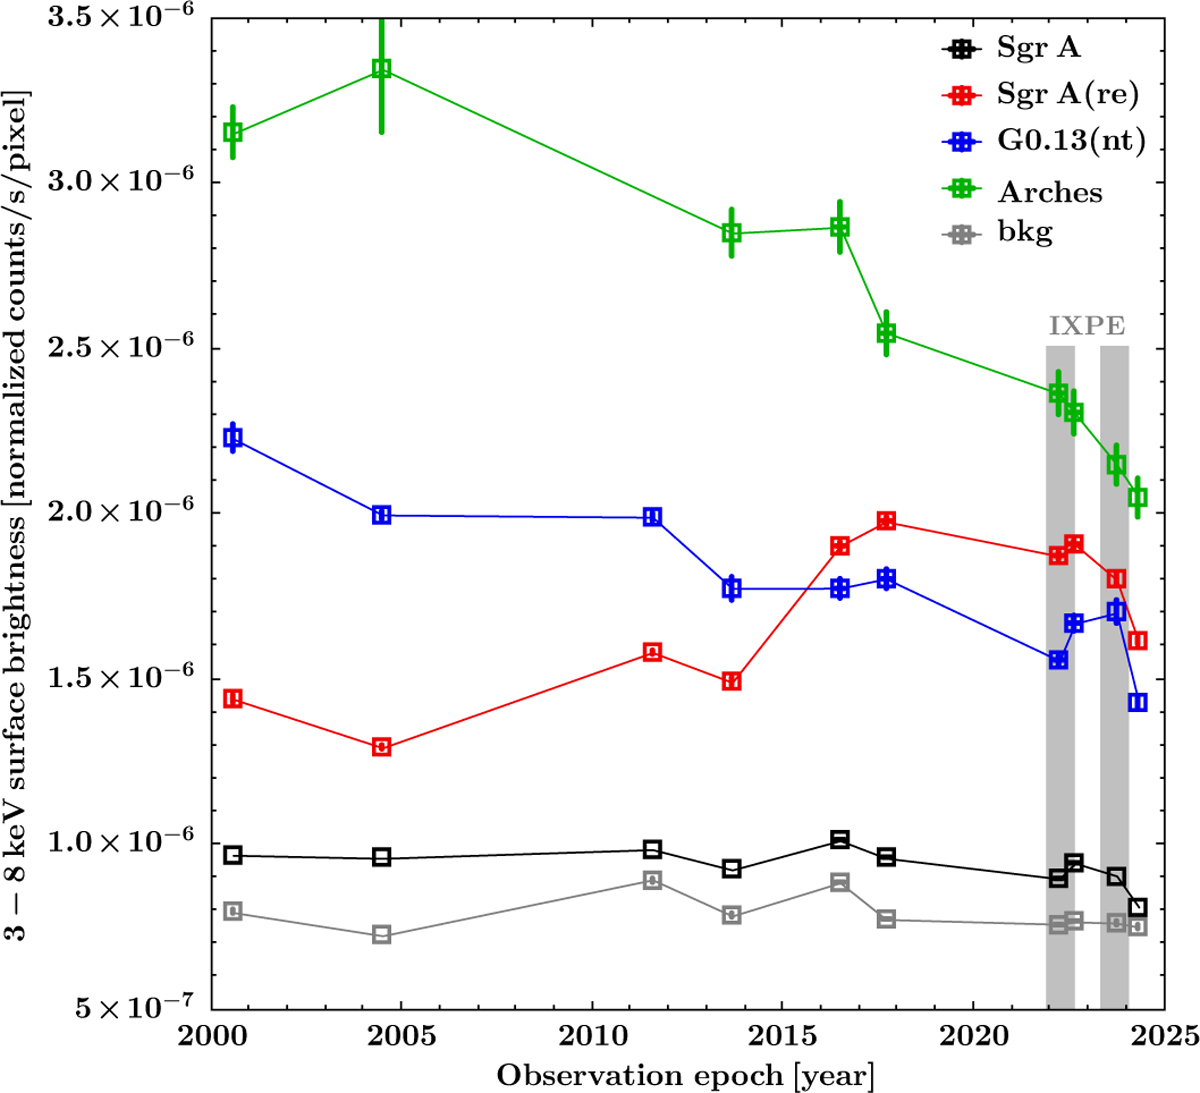
Epoch-to-epoch variations in the 3–8 keV surface brightness (normalized per 0.5″ × 0.5″ pixels after subtraction of the particle background) for the regions depicted in Fig. 2. Namely, this figure shows the light curves for a region encompassing the Arches cluster (green), the central brightest region of the Sgr A complex (red), the nonthermal (NT) nebula G0.13-0.11 (blue), and the full Sgr A complex excluding the last two subregions (black) in comparison to a nearby background region (gray). The full time span of the observations is more than 20 years, and the time windows encompassing IXPE observations are shown as shaded boxes. For most of the data points, the statistical uncertainty of the flux measurement is smaller than the symbol size.
Current usage metrics show cumulative count of Article Views (full-text article views including HTML views, PDF and ePub downloads, according to the available data) and Abstracts Views on Vision4Press platform.
Data correspond to usage on the plateform after 2015. The current usage metrics is available 48-96 hours after online publication and is updated daily on week days.
Initial download of the metrics may take a while.