Fig. 4
Download original image
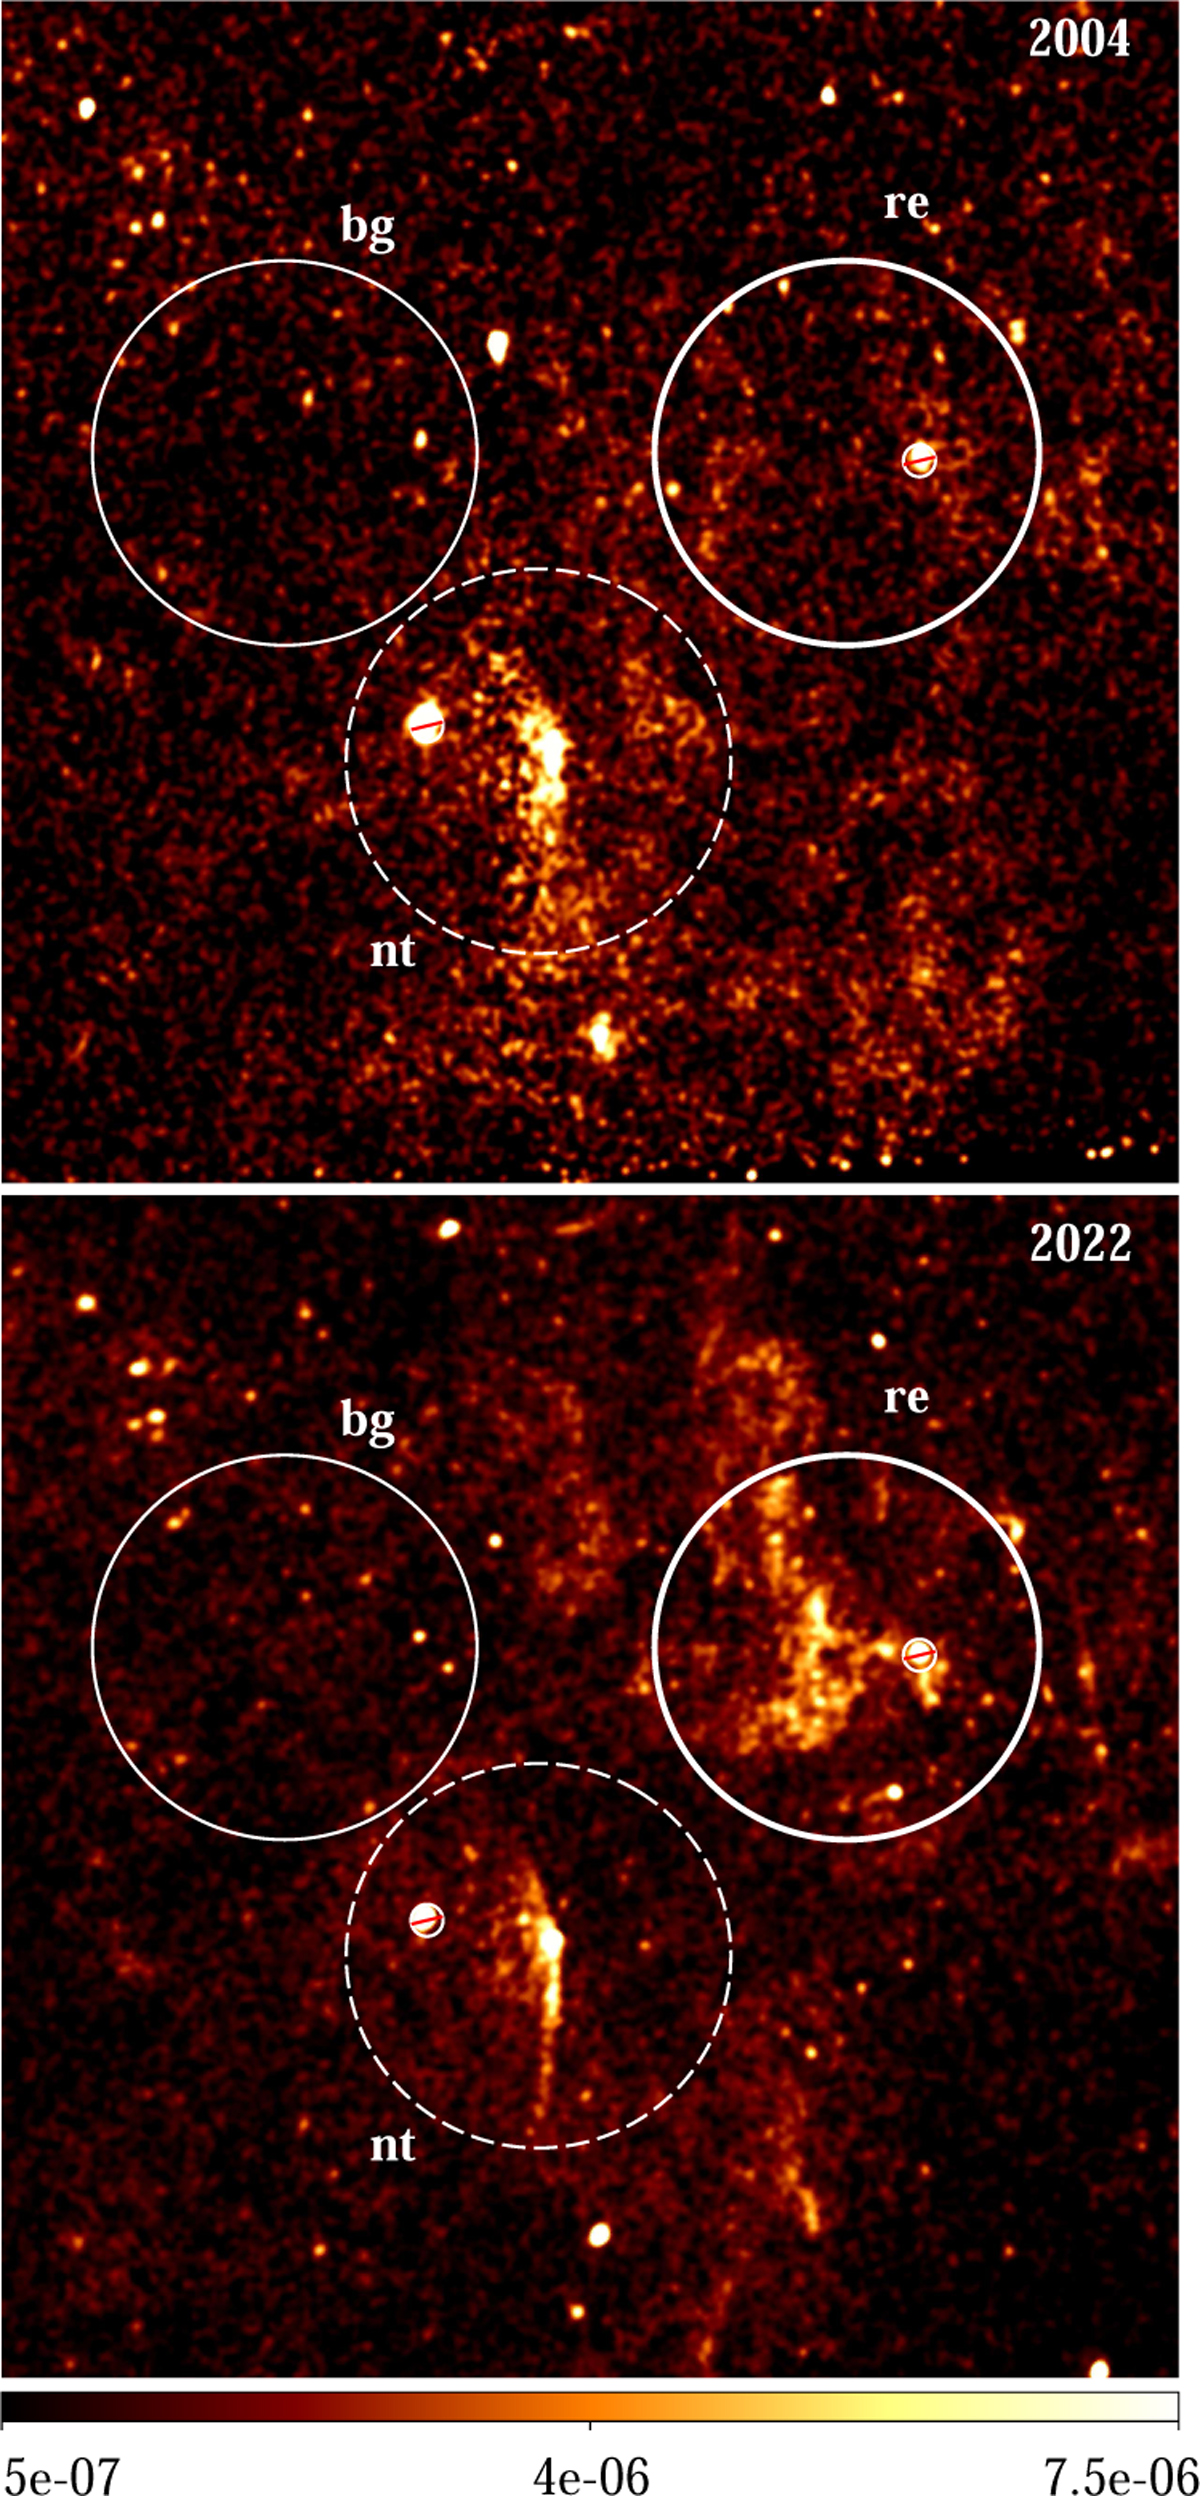
Same as Fig. 2 but showing a zoom-in of the interior part of the Sgr A complex and focusing on the difference between two epochs, 2004 (top) and 2022 (bottom), to highlight the small-scale variations in the morphology of the diffuse emission. Big circular regions are 1′ in radius and are used for the differential spectral analysis (after masking the brightest point sources marked with small crossed circles). These regions correspond to the brightest reflection spot (marked “re”), a region dominated by nonthermal emission of the PWN G0.13-0.11 (marked “nt”), and a representative subregion of the Sgr A complex (marked “bg”).
Current usage metrics show cumulative count of Article Views (full-text article views including HTML views, PDF and ePub downloads, according to the available data) and Abstracts Views on Vision4Press platform.
Data correspond to usage on the plateform after 2015. The current usage metrics is available 48-96 hours after online publication and is updated daily on week days.
Initial download of the metrics may take a while.