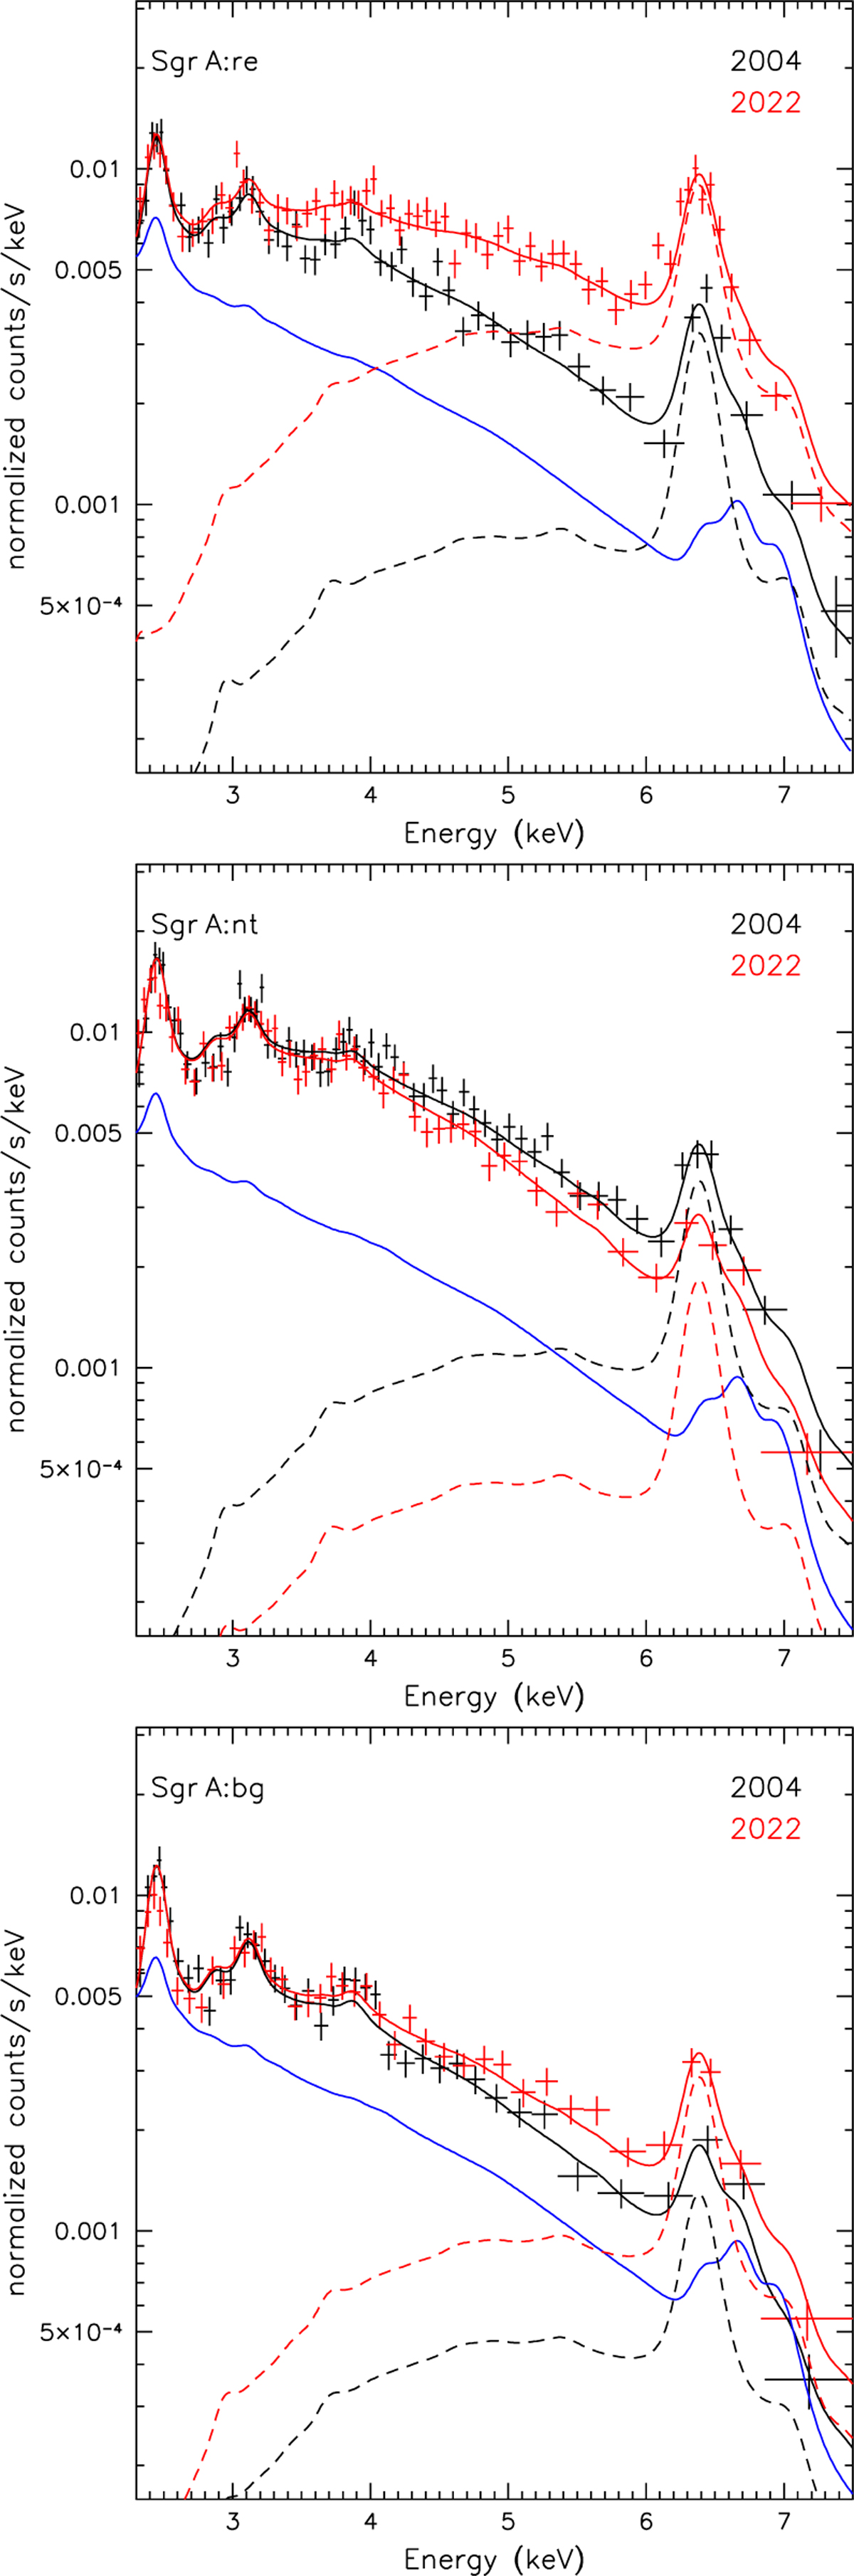
Fig. 5
Download original image
Epoch-to-epoch variations in the spectra of several regions within the Sgr A complex shown in Fig. 4. Top panel: brightest (in 2022) reflection region, “Sgr A:re”. Middle panel: region around G0.13-0.11, “Sgr A:nt”. Bottom panel: relatively faint region within the Sgr A complex, “Sgr A:bg”. The spectra taken from Chandra observations in 2004 (black) and 2022 (red) are fit with the same model with all parameters tied except for normalizations of the reflected continuum and fluorescent lines. The composite reflection models for each observation are shown with dashed lines. The expected contribution of the spatially smooth Galactic bulge emission is shown in blue for comparison. The data were binned only for visualization purposes.
Current usage metrics show cumulative count of Article Views (full-text article views including HTML views, PDF and ePub downloads, according to the available data) and Abstracts Views on Vision4Press platform.
Data correspond to usage on the plateform after 2015. The current usage metrics is available 48-96 hours after online publication and is updated daily on week days.
Initial download of the metrics may take a while.