Fig. 7
Download original image
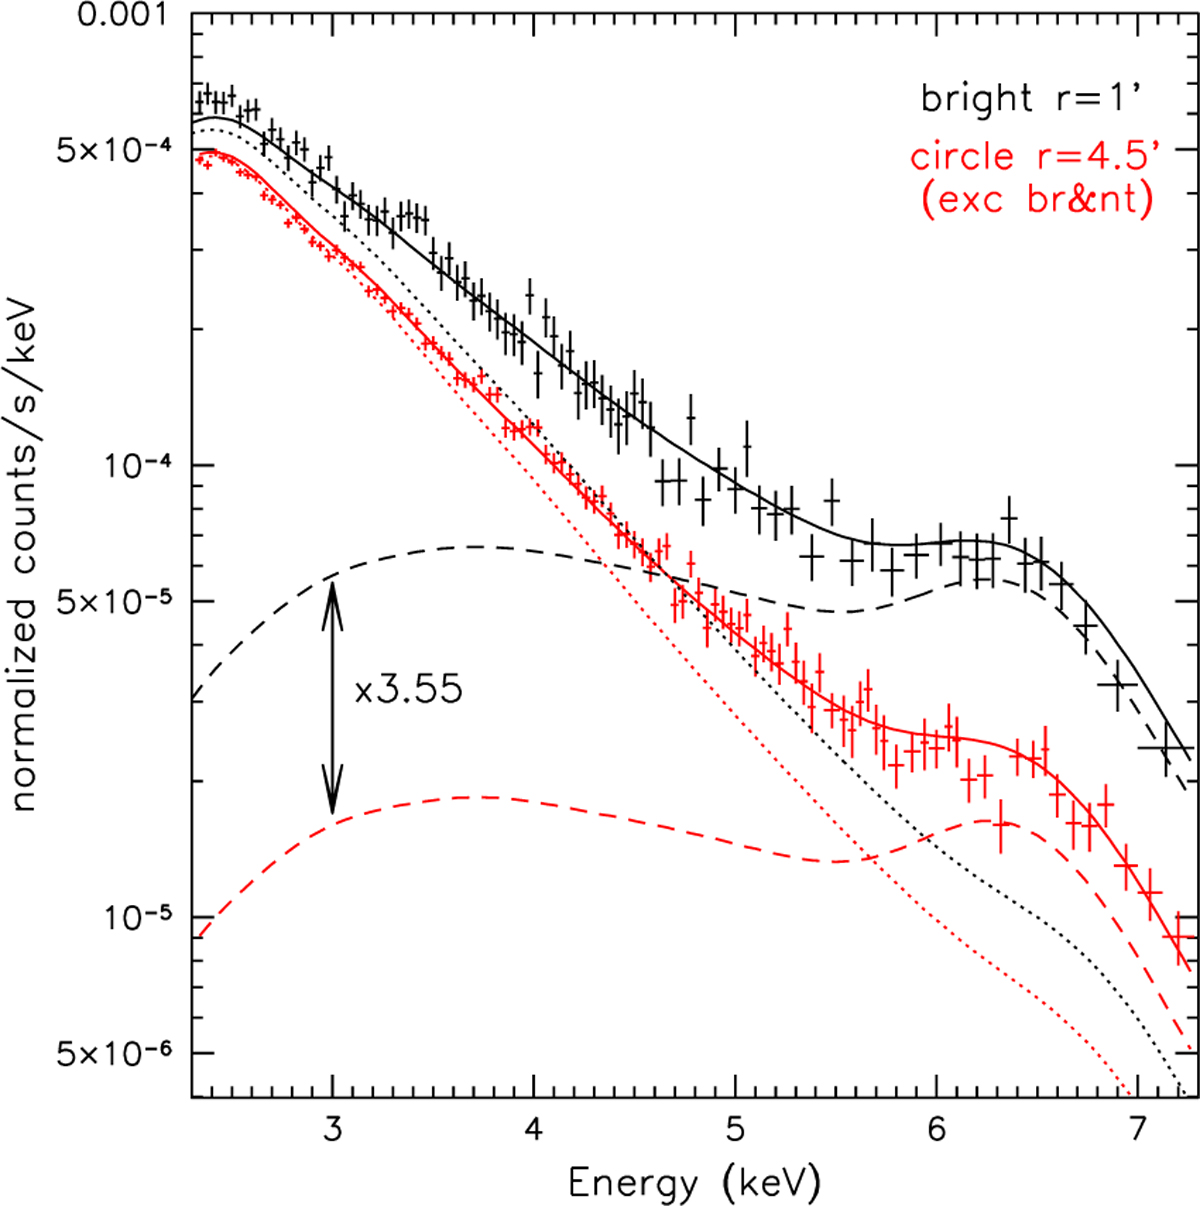
Spectra from IXPE for the two regions used for the polarimetric measurements of the reflected emission. The solid lines show the total spectral models inferred from the Chandra data, while dashed and dotted lines show contributions of the reflection and non-reflection emission for each region. The surface brightness of the reflected continuum in the brightest region is 3.55 times higher than in the large circle region. The data were slightly binned (in the high-energy part) for visualization purposes only.
Current usage metrics show cumulative count of Article Views (full-text article views including HTML views, PDF and ePub downloads, according to the available data) and Abstracts Views on Vision4Press platform.
Data correspond to usage on the plateform after 2015. The current usage metrics is available 48-96 hours after online publication and is updated daily on week days.
Initial download of the metrics may take a while.