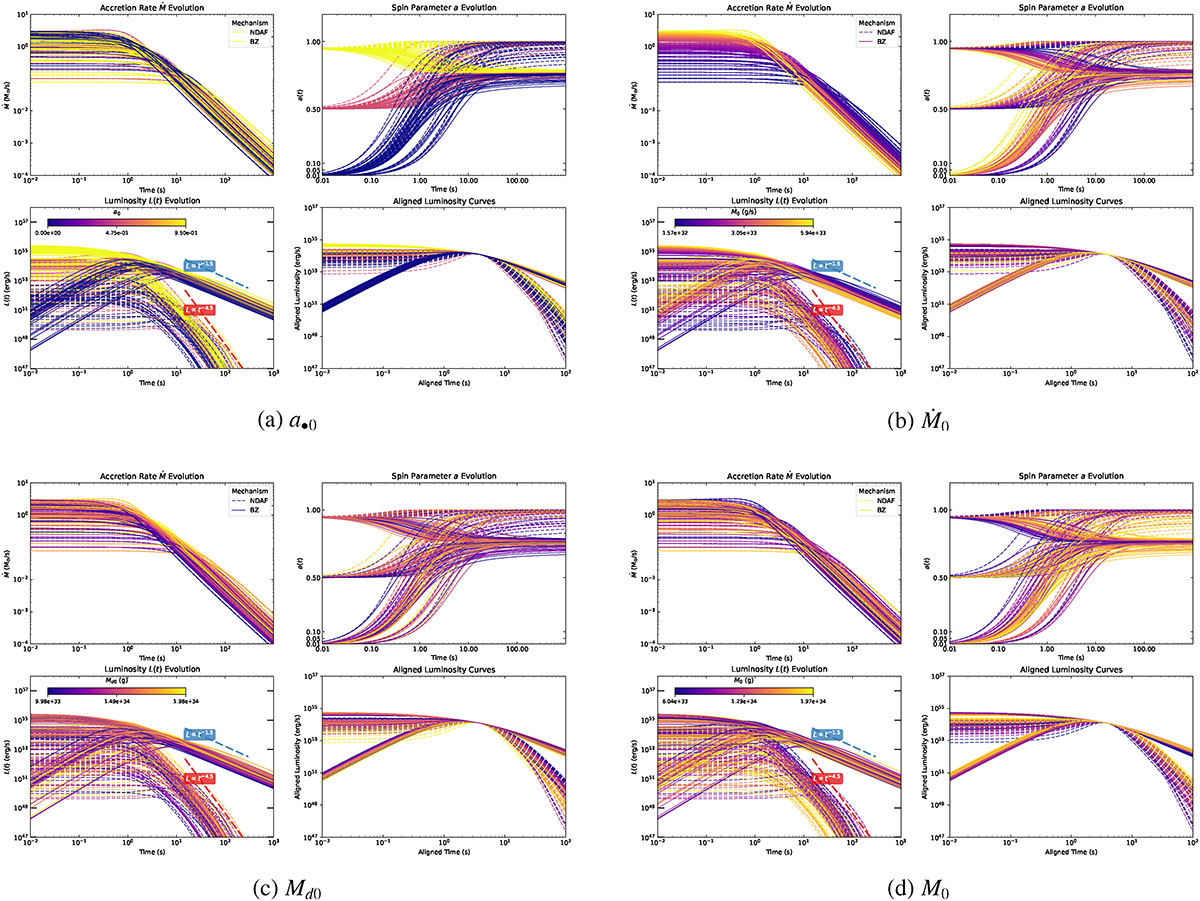
Fig. 1.
Download original image
Simulated long-GRB light curves for two central engine mechanisms: NDAF and BZ. The NDAF model exhibits a steep decay, whereas the BZ model shows a more gradual one. Colours represent variations in initial parameters – (a) black hole spin, (b) accretion rate, (c) accretion disc mass, and (d) black hole mass – illustrated by the colour bars. For each parameter set, the top left panel shows the evolution of the accretion rate over time; the top right panel shows the evolution of the spin parameter; the bottom left panel shows the luminosity evolution, where the NDAF model is plotted as red dashed lines (typical slope −4.5) and the BZ model as blue dashed lines (typical slope −1.5); and the bottom right panel compares the two mechanisms after alignment.
Current usage metrics show cumulative count of Article Views (full-text article views including HTML views, PDF and ePub downloads, according to the available data) and Abstracts Views on Vision4Press platform.
Data correspond to usage on the plateform after 2015. The current usage metrics is available 48-96 hours after online publication and is updated daily on week days.
Initial download of the metrics may take a while.