Fig. 3.
Download original image
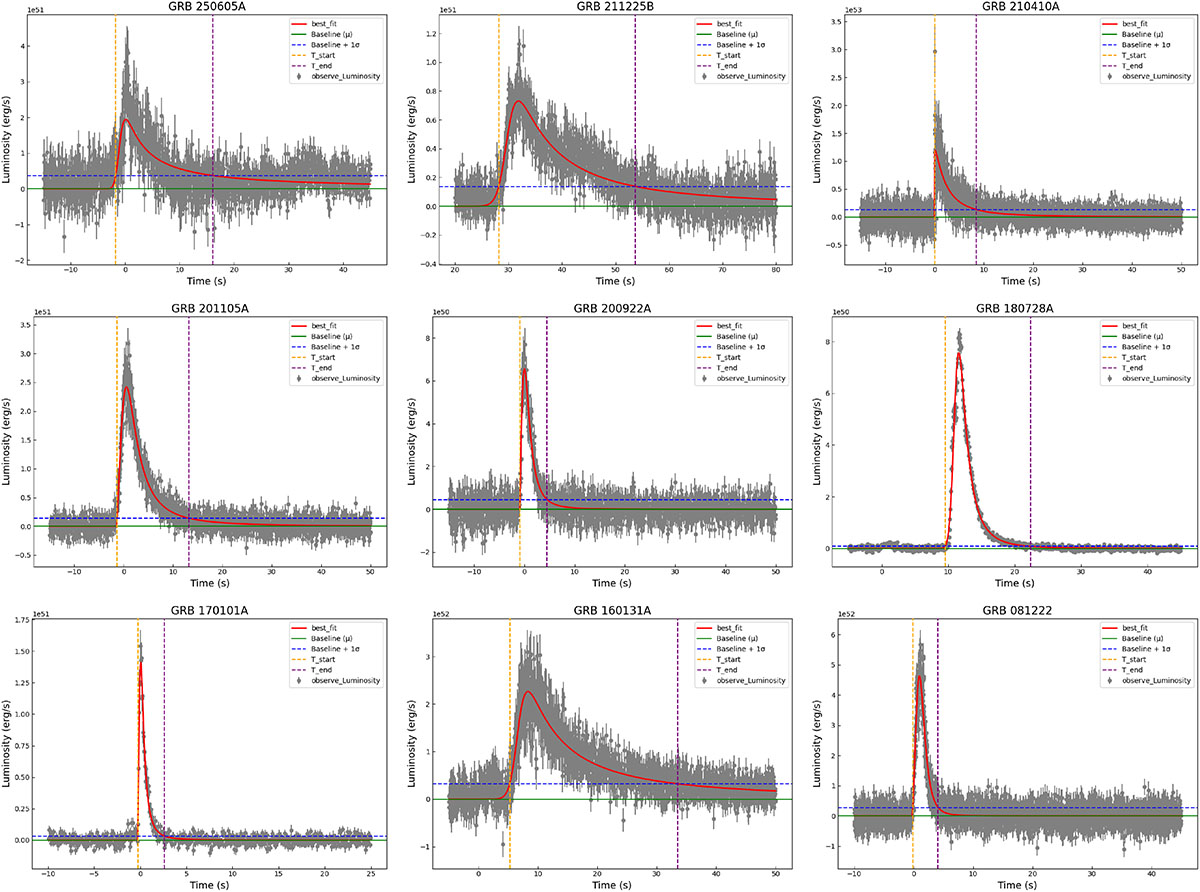
Examples of fitting light curves (1–10 000 keV) to the KRL model (red lines) for GRB 081222, GRB 161218A, GRB 170101A, GRB 180728A, GRB 200922A, GRB 201105A, GRB 210410A, GRB 211225B, and GRB 250605A. The dashed vertical lines indicate the pulse start and end times. The observed data (shown in grey) have been corrected for redshift, and the corresponding fitting parameters are listed in Table 1.
Current usage metrics show cumulative count of Article Views (full-text article views including HTML views, PDF and ePub downloads, according to the available data) and Abstracts Views on Vision4Press platform.
Data correspond to usage on the plateform after 2015. The current usage metrics is available 48-96 hours after online publication and is updated daily on week days.
Initial download of the metrics may take a while.