Fig. 4.
Download original image
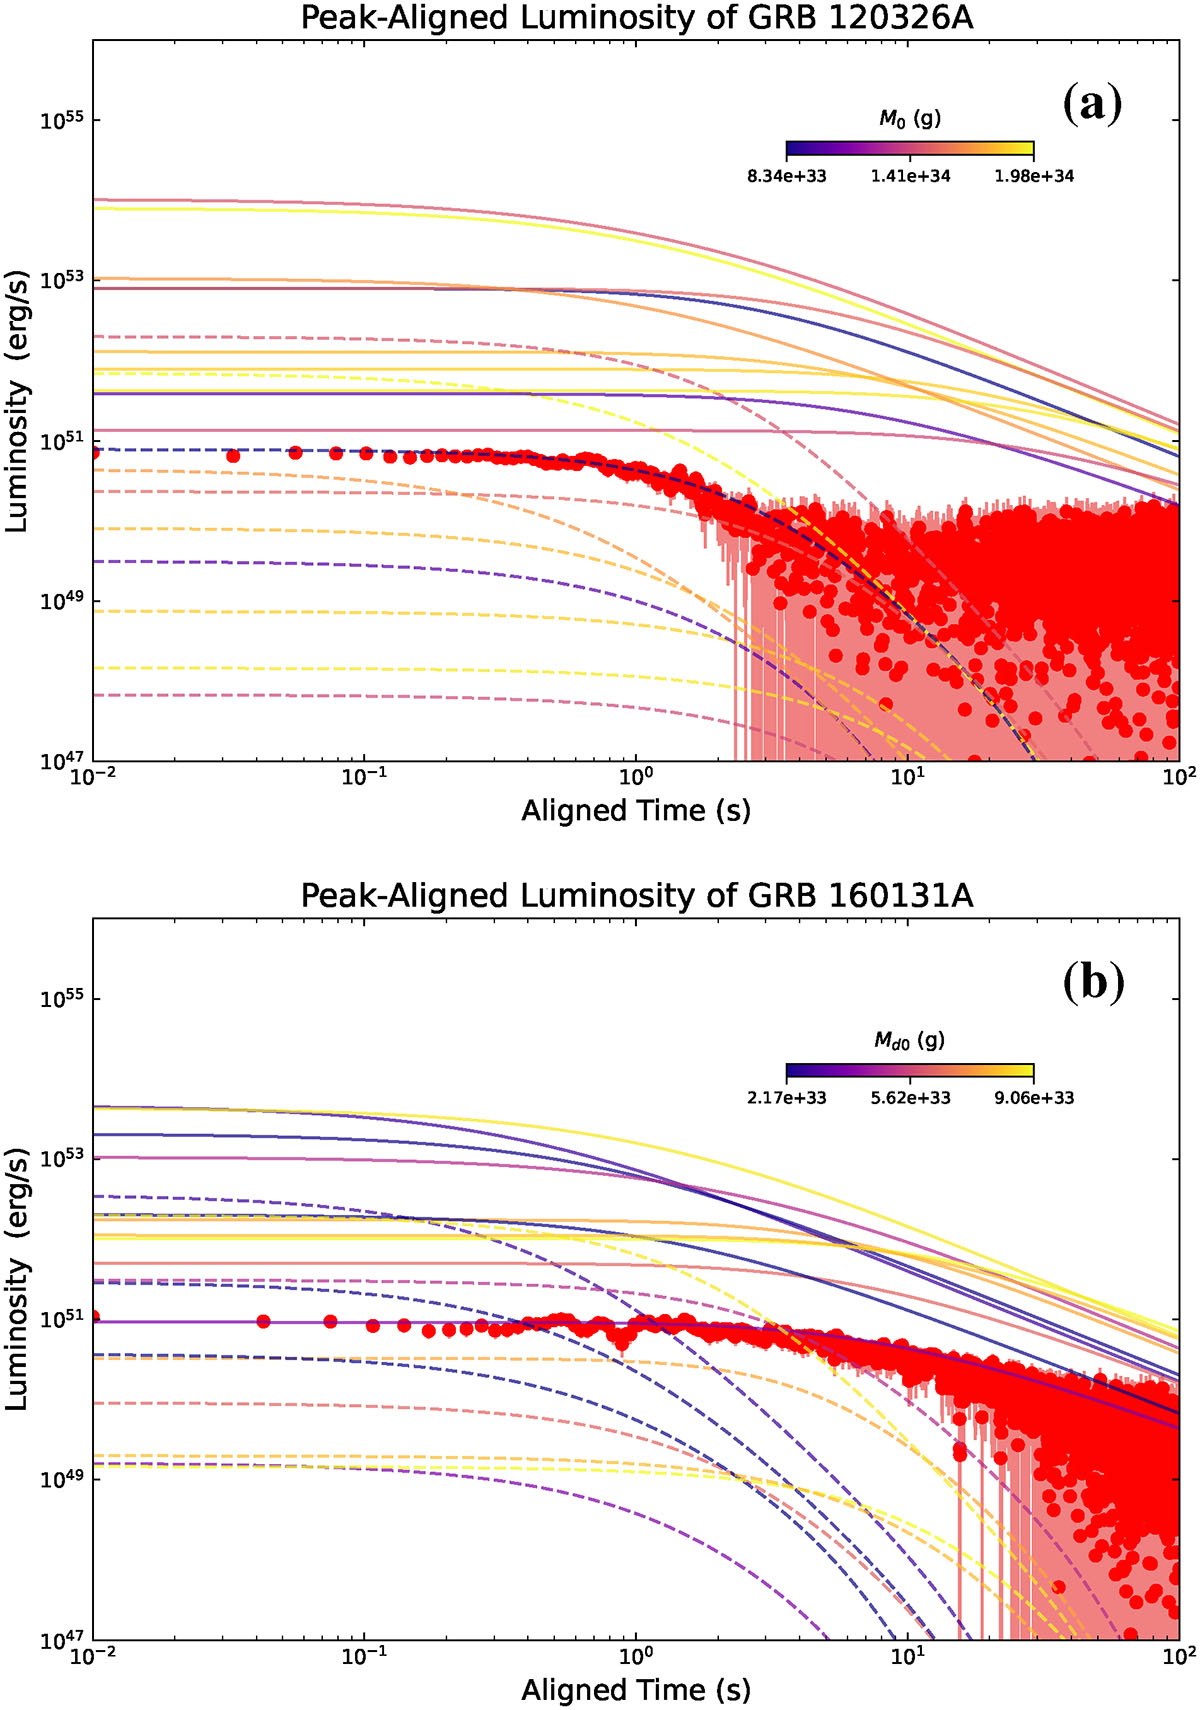
Comparison between theoretical models and observational data for (a) GRB 120326A and (b) GRB 160131A. Theoretical light curves are shown for the Blandford–Znajek (BZ) mechanism (solid lines) and the neutrino-dominated accretion flow (NDAF) mechanism (dashed lines), following the same convention as in Figures 1 and 2. Observational data are indicated by red circles, with lighter shading showing the error bars. The upper panel exhibits a steep luminosity decay (![]() –t−7.83), consistent with NDAF predictions, whereas the lower panel shows a shallower decay (L ∝ t−1.67), matching BZ model expectations.
–t−7.83), consistent with NDAF predictions, whereas the lower panel shows a shallower decay (L ∝ t−1.67), matching BZ model expectations.
Current usage metrics show cumulative count of Article Views (full-text article views including HTML views, PDF and ePub downloads, according to the available data) and Abstracts Views on Vision4Press platform.
Data correspond to usage on the plateform after 2015. The current usage metrics is available 48-96 hours after online publication and is updated daily on week days.
Initial download of the metrics may take a while.