Open Access
Fig. A.1.
Download original image
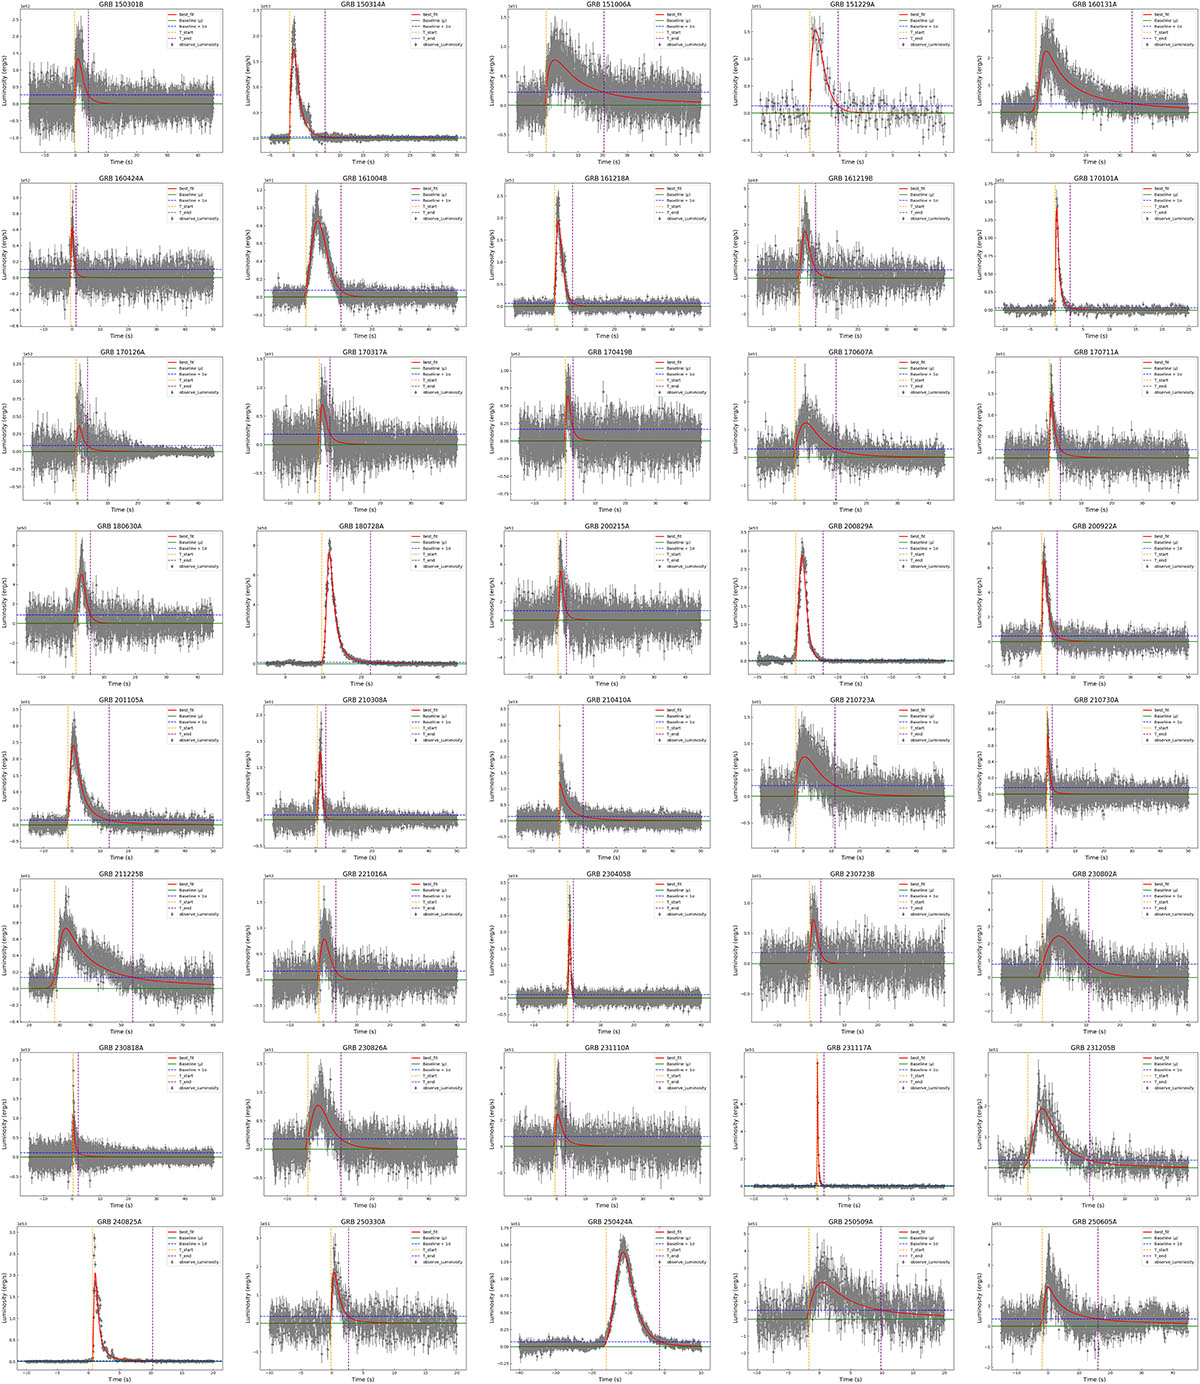
Light-curve fitting of 85 GRBs using the KRL function (red lines). The dotted lines indicate the pulse start and end times. The data have been corrected for redshift, and the observed data are shown in grey.
Current usage metrics show cumulative count of Article Views (full-text article views including HTML views, PDF and ePub downloads, according to the available data) and Abstracts Views on Vision4Press platform.
Data correspond to usage on the plateform after 2015. The current usage metrics is available 48-96 hours after online publication and is updated daily on week days.
Initial download of the metrics may take a while.