Open Access
Fig. B.1.
Download original image
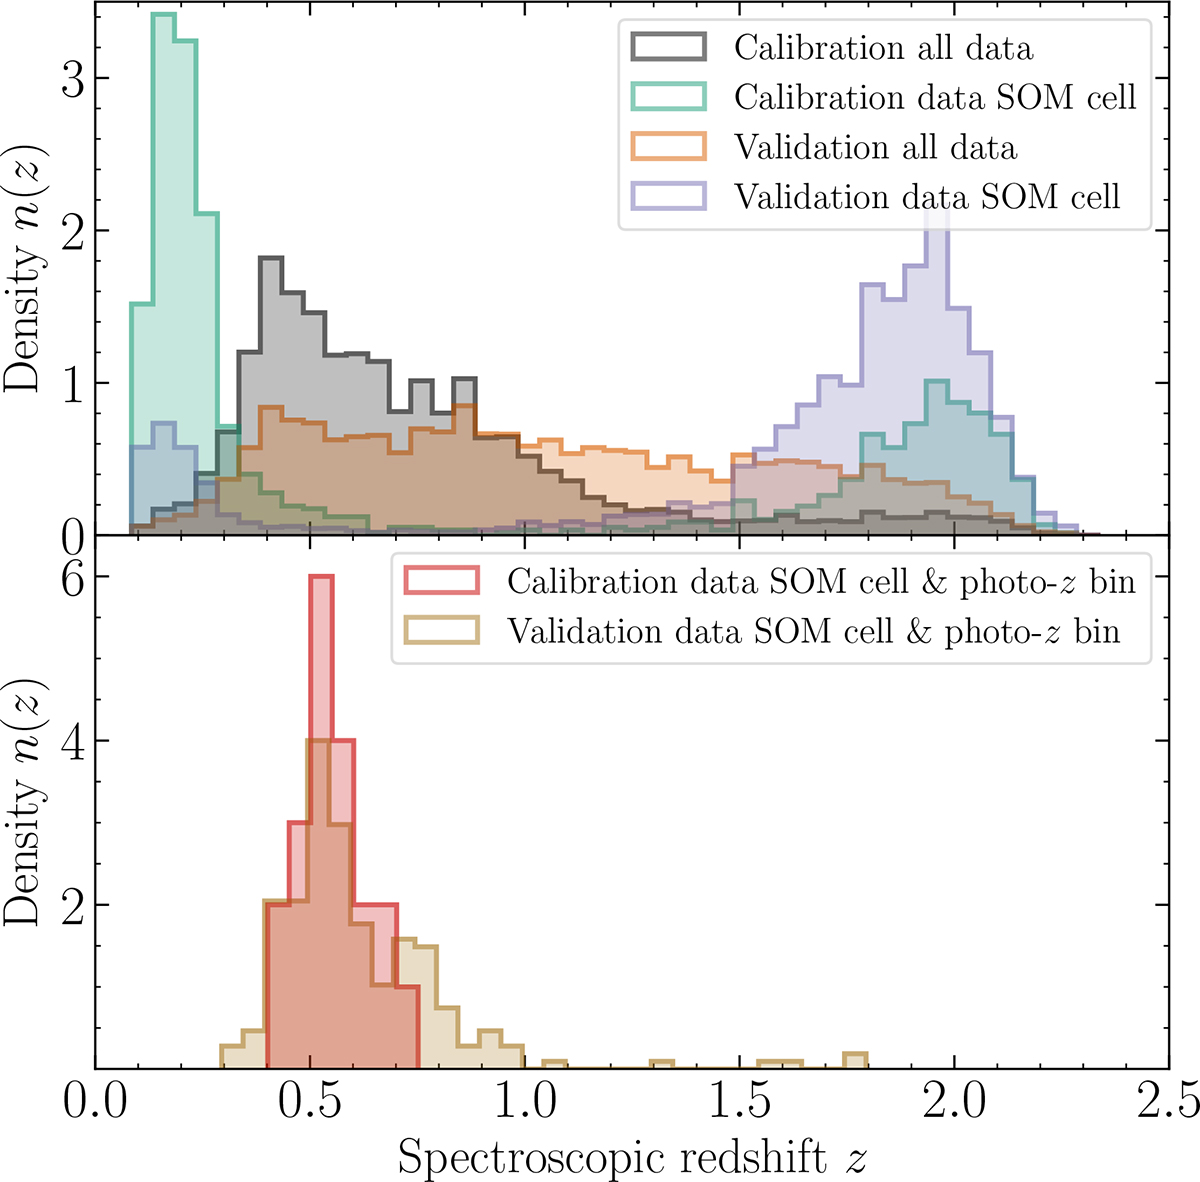
Top: Mean spec-z distributions for the validation and calibration sample subject to a non-trivial selection function. The respective distributions are also depicted for a single SOM cell chosen at random. Bottom: Display of the distributions found for the same randomly selected cell after applying photo-z binning.
Current usage metrics show cumulative count of Article Views (full-text article views including HTML views, PDF and ePub downloads, according to the available data) and Abstracts Views on Vision4Press platform.
Data correspond to usage on the plateform after 2015. The current usage metrics is available 48-96 hours after online publication and is updated daily on week days.
Initial download of the metrics may take a while.