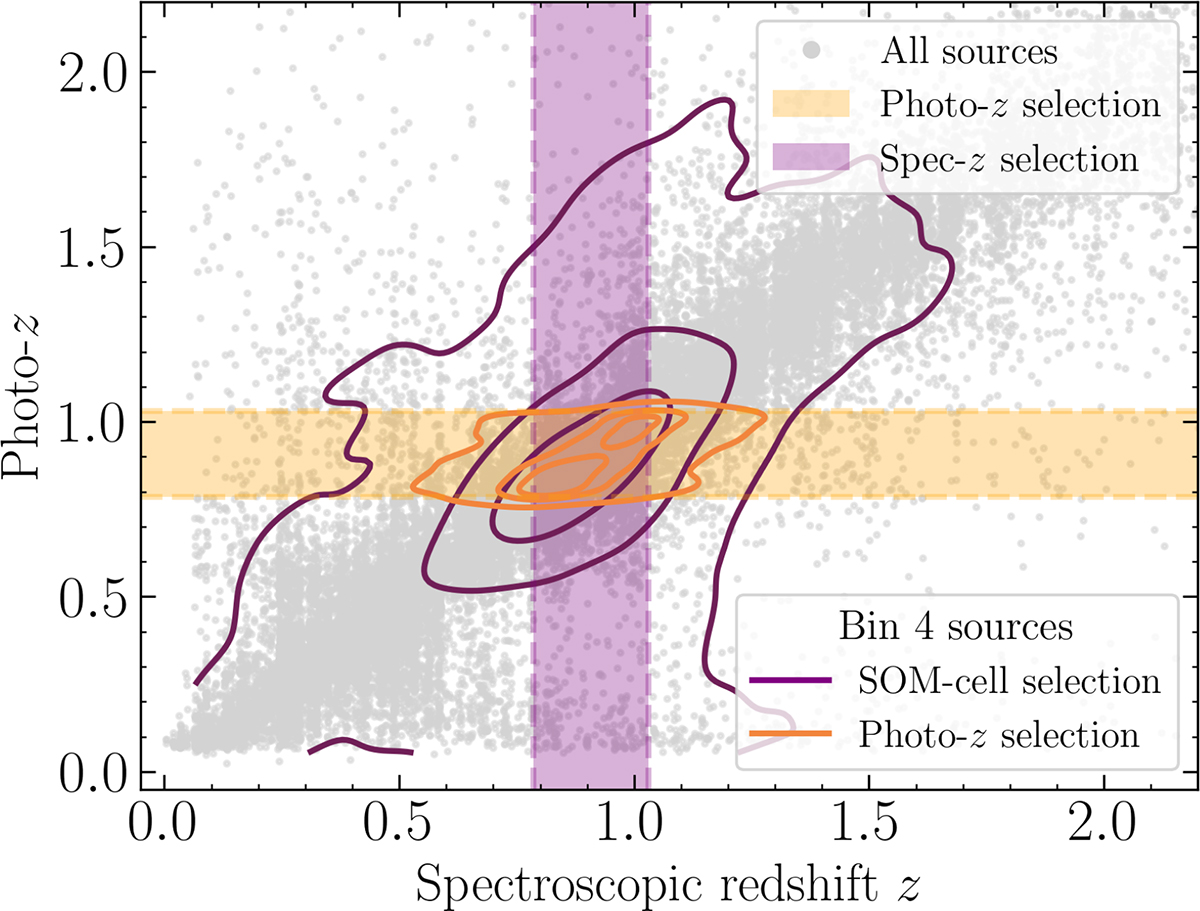
Fig. C.1.
Download original image
Distribution of photo-z over spec-z, where the full sample is shown in grey, and the shaded areas represent the fourth tomographic bin listed in Table 2 for photometric and spectroscopic redshift (orange and purple bands, respectively). Overlaid are 1, 2, and 3σ completeness contours for the two selection strategies: photo-z binning within the SOM (orange) and mean spec-z binning per SOM cell (purple).
Current usage metrics show cumulative count of Article Views (full-text article views including HTML views, PDF and ePub downloads, according to the available data) and Abstracts Views on Vision4Press platform.
Data correspond to usage on the plateform after 2015. The current usage metrics is available 48-96 hours after online publication and is updated daily on week days.
Initial download of the metrics may take a while.