Fig. 4.
Download original image
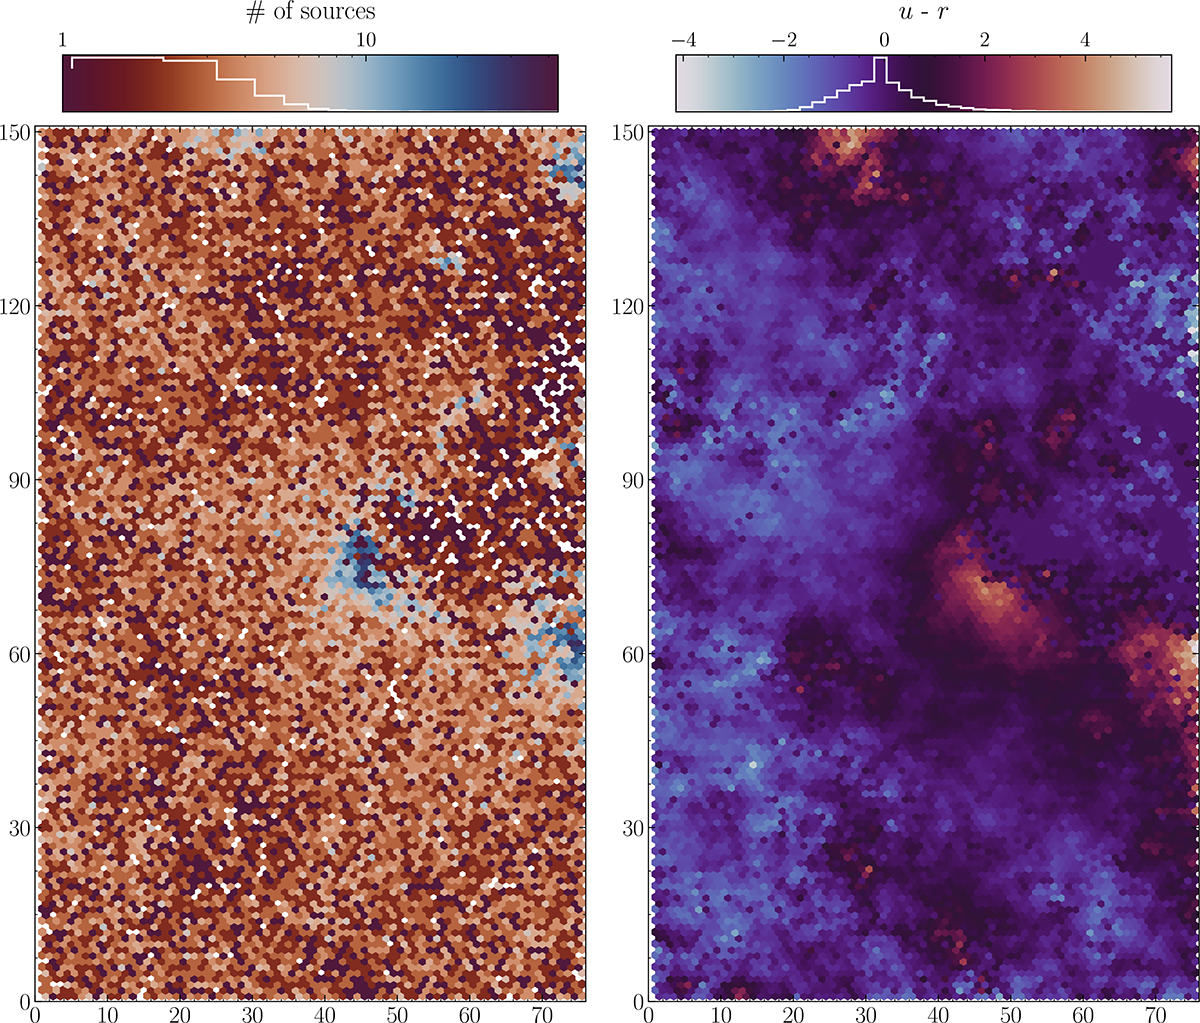
Masters-like SOM coloured according to different properties of the calibration sample. These include the occupation count (left) and the cells’ average u − r colour (right). Furthermore, cells lacking a representation of physical quantities are painted white. The white histograms overlaid within the upper colour bars represent the normalised linear distributions of the respective SOM statistics.
Current usage metrics show cumulative count of Article Views (full-text article views including HTML views, PDF and ePub downloads, according to the available data) and Abstracts Views on Vision4Press platform.
Data correspond to usage on the plateform after 2015. The current usage metrics is available 48-96 hours after online publication and is updated daily on week days.
Initial download of the metrics may take a while.