Open Access
Fig. 5.
Download original image
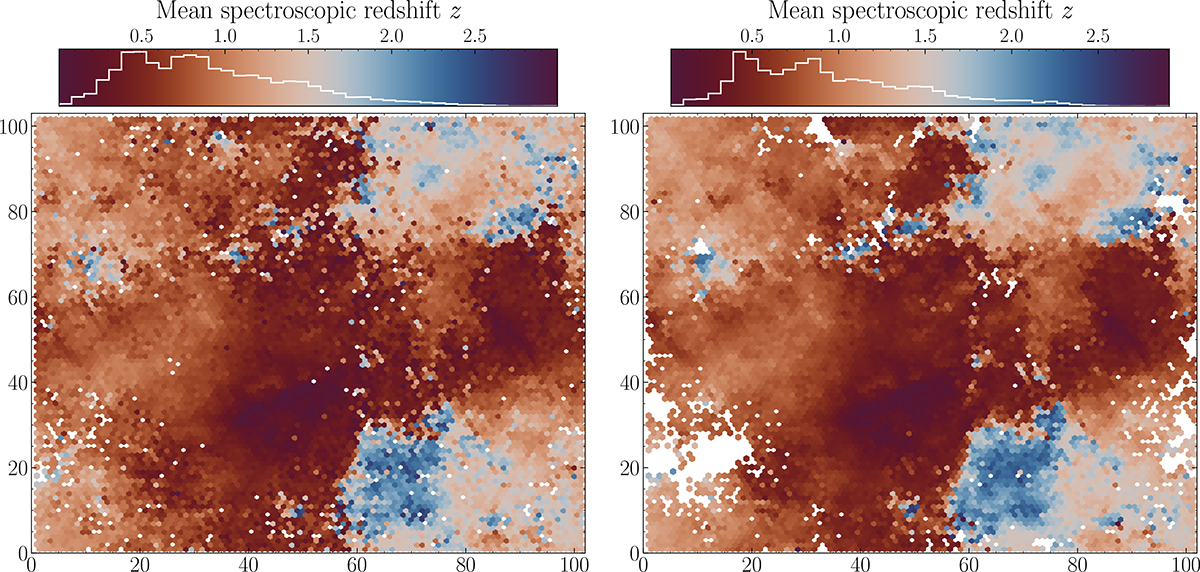
Noisy SOM painted by the mean spec-z for both the calibration sample used in training (left panel) and the validation sample (right panel). A similar underlying pattern is visible. Areas of spectroscopic incompleteness, coloured in white, cannot be used for calibration purposes as per the gold sample selection.
Current usage metrics show cumulative count of Article Views (full-text article views including HTML views, PDF and ePub downloads, according to the available data) and Abstracts Views on Vision4Press platform.
Data correspond to usage on the plateform after 2015. The current usage metrics is available 48-96 hours after online publication and is updated daily on week days.
Initial download of the metrics may take a while.