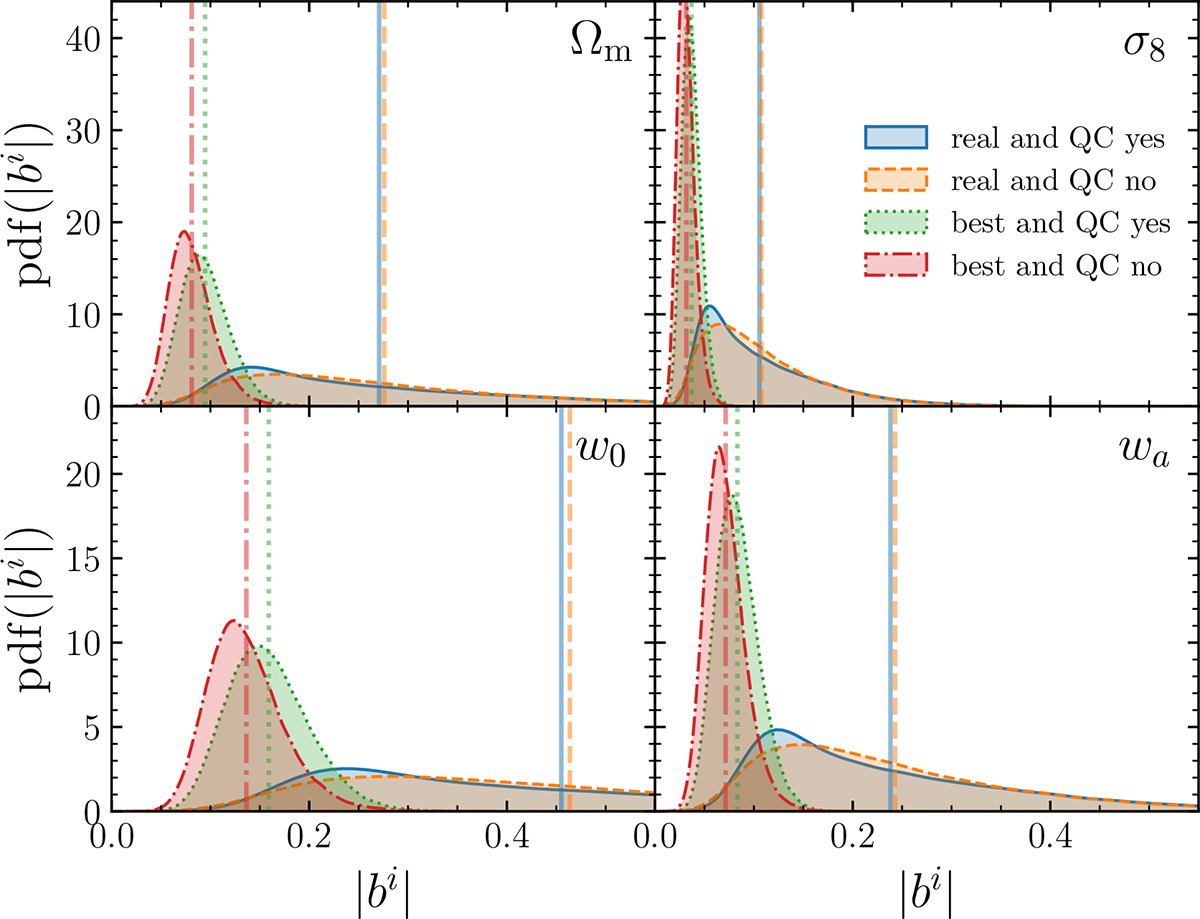
Fig. 8.
Download original image
Forecasted absolute biases in units of standard deviations for cosmological parameters. Each panel shows a different cosmological parameter; the different line styles and colours correspond to the different cases presented in Sect. 4.4 and Appendix C. The vertical lines indicate the expected bias corresponding to each case. The kernel density estimate was taken from 106 realisations of the n(z).
Current usage metrics show cumulative count of Article Views (full-text article views including HTML views, PDF and ePub downloads, according to the available data) and Abstracts Views on Vision4Press platform.
Data correspond to usage on the plateform after 2015. The current usage metrics is available 48-96 hours after online publication and is updated daily on week days.
Initial download of the metrics may take a while.