Fig. A.1.
Download original image
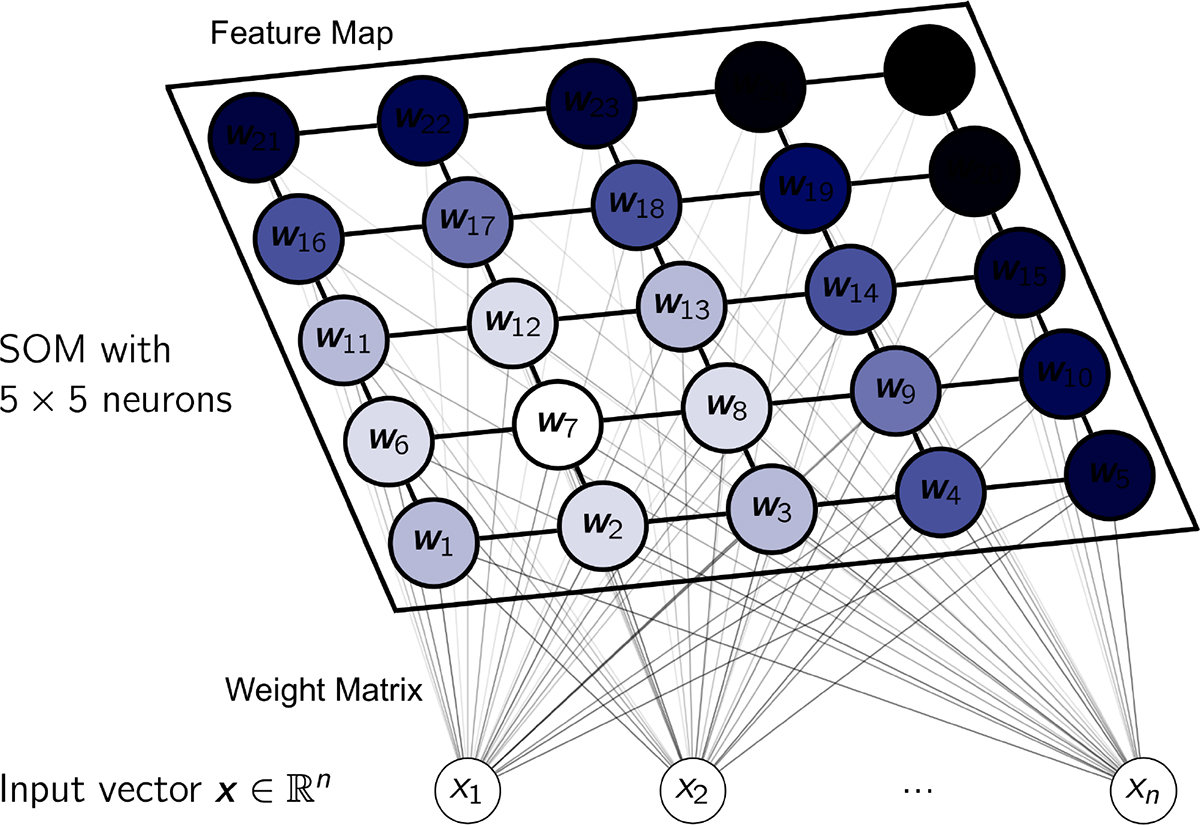
Architecture of a 5×5 neuron SOM with a Kohonen layer, depicted here as ‘Feature Map’. The input vector x is mapped onto the neurons, represented by their weight vectors wi. The best matching unit (here w7) and the surrounding weights are adjusted according to the current learning rate and neighbourhood function. The neurons in this example are coloured based on the magnitude of the adjustment in the current training step, where white are high magnitudes of adjustment and black are low magnitudes. Adapted from van den Busch (2021).
Current usage metrics show cumulative count of Article Views (full-text article views including HTML views, PDF and ePub downloads, according to the available data) and Abstracts Views on Vision4Press platform.
Data correspond to usage on the plateform after 2015. The current usage metrics is available 48-96 hours after online publication and is updated daily on week days.
Initial download of the metrics may take a while.