Fig. 1
Download original image
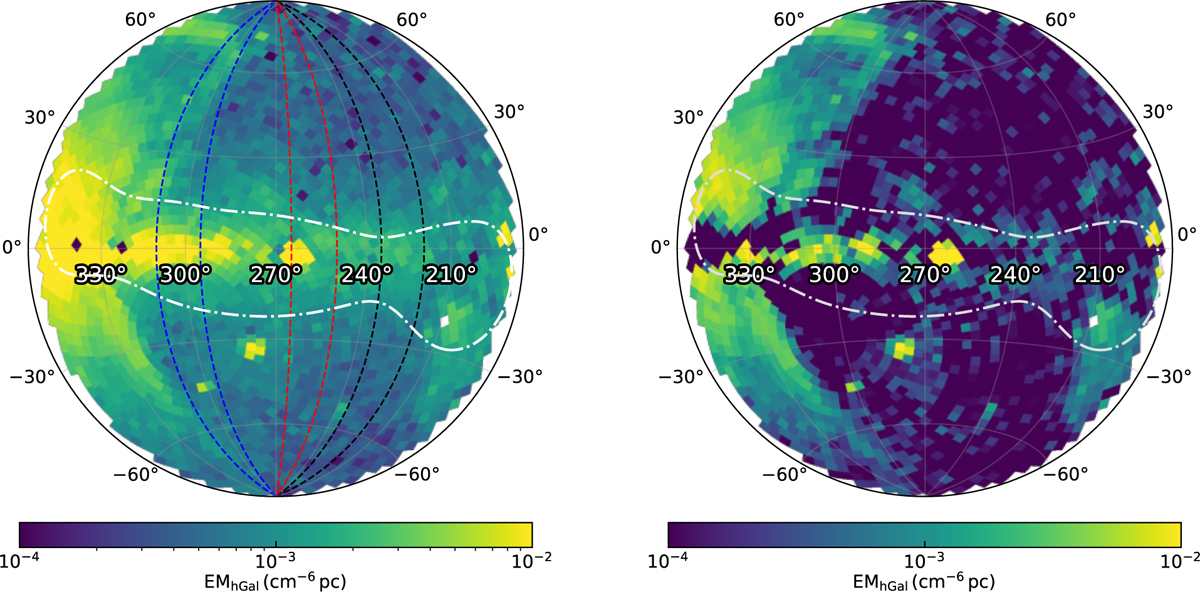
Left panel: logarithm of emission measure of the 0.7 keV Galactic emission as observed by eROSITA in the western Galactic hemisphere when fitting the total X-ray emission (diffuse and point sources); it is given in Galactic coordinates and in zenithal equal-area projection centred on (l = 270◦, b = 0◦). The dashed black, red, and blue lines show the longitudinal stripes in Fig. 5. The dot-dashed white contours indicate the region with the highest concentration of stars within 500 pc of the Sun, as shown in Fig. G.1. Right panel: same as left panel, but once the stellar contribution, as described by Hunter et al. (2024), had been removed.
Current usage metrics show cumulative count of Article Views (full-text article views including HTML views, PDF and ePub downloads, according to the available data) and Abstracts Views on Vision4Press platform.
Data correspond to usage on the plateform after 2015. The current usage metrics is available 48-96 hours after online publication and is updated daily on week days.
Initial download of the metrics may take a while.