Fig. F.1
Download original image
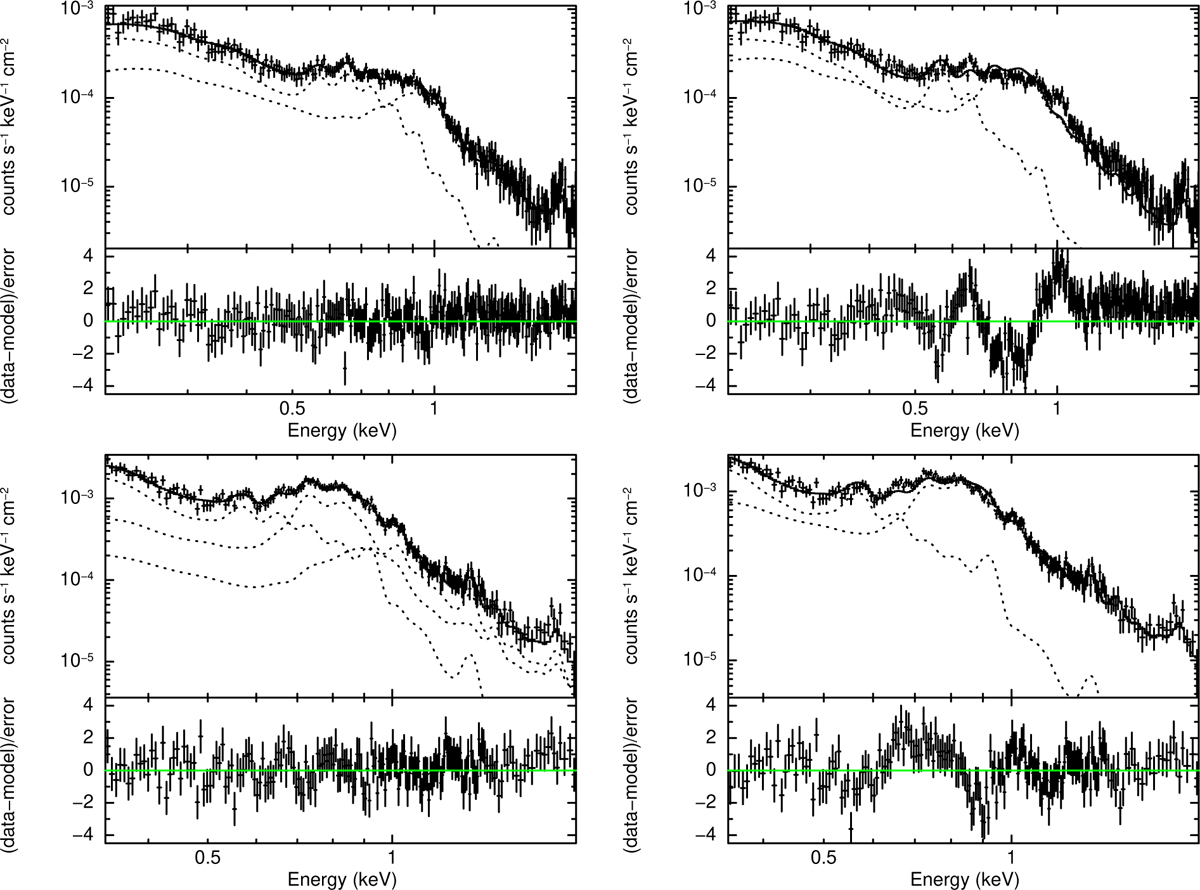
Stacked eROSITA spectra of the 96 M dwarf (top row) and the 30 FGK stars (bottom row) in the western Galactic hemisphere and within 10 pc of the Sun (Zheng et al. in prep.). The stack is computed as if all stars were at 10 pc from us. The left column shows the average spectra and the best fit model, composed of two to three thermal components with variable elemental abundances. In contrast, the right column shows the spectra and residuals for a fit with a two-temperature model with abundances fixed at the solar value and the temperatures fixed at 0.2 and 0.7 keV.
Current usage metrics show cumulative count of Article Views (full-text article views including HTML views, PDF and ePub downloads, according to the available data) and Abstracts Views on Vision4Press platform.
Data correspond to usage on the plateform after 2015. The current usage metrics is available 48-96 hours after online publication and is updated daily on week days.
Initial download of the metrics may take a while.