Fig. 2
Download original image
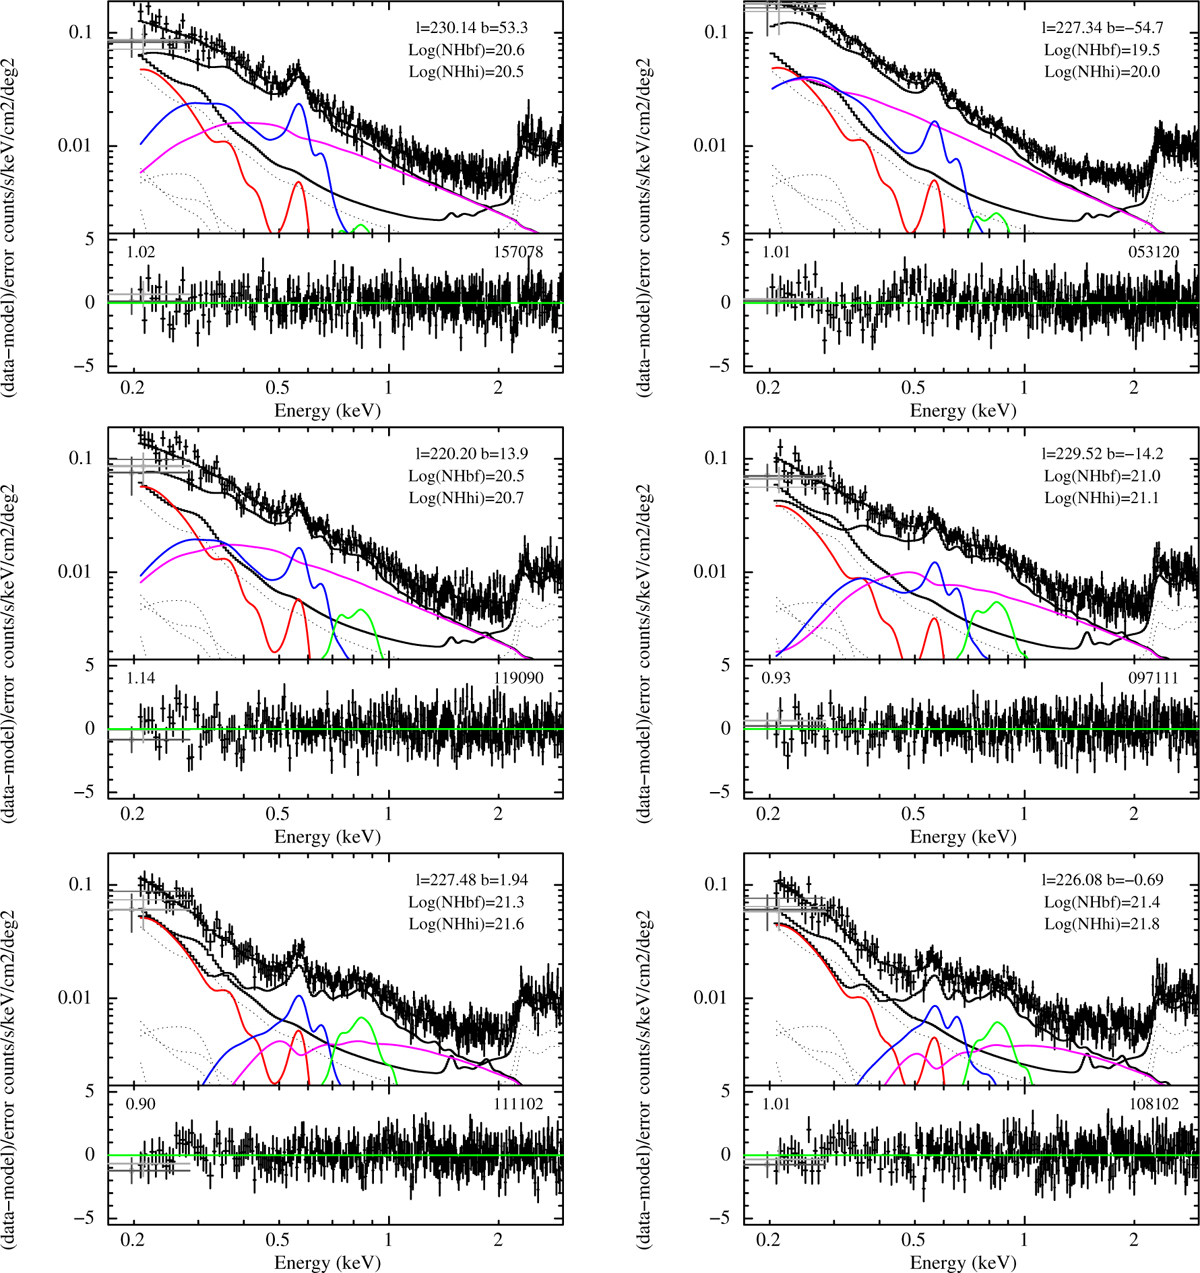
Best-fit spectra for six selected sky tiles within 220◦ < l < 235◦, within the dashed black lines shown in Fig. 1. The left column shows spectra within the northern hemisphere at decreasing latitudes. The right column shows spectra at similar latitudes in the southern hemisphere. The black data show the eROSITA spectrum, while the grey points show the flux measured by ROSAT in the softest bands. The solid lines show the contribution from the local hot bubble (red), the warm-hot bubble (blue), the 0.7 keV component (green), the cosmic X-ray background (CXB; magenta), and the instrumental background (black). The inset reports the Galactic latitude and longitude of the centre of the sky tile as well as the total hydrogen column density of neutral absorption derived from the HI4PI survey NH,HI4 and the best-fit value, NH,bf. The dotted lines show the contribution of the various components of the instrumental background. The lower panels show the fit residuals, with the sky tile number and reduced χ2.
Current usage metrics show cumulative count of Article Views (full-text article views including HTML views, PDF and ePub downloads, according to the available data) and Abstracts Views on Vision4Press platform.
Data correspond to usage on the plateform after 2015. The current usage metrics is available 48-96 hours after online publication and is updated daily on week days.
Initial download of the metrics may take a while.