Fig. 3
Download original image
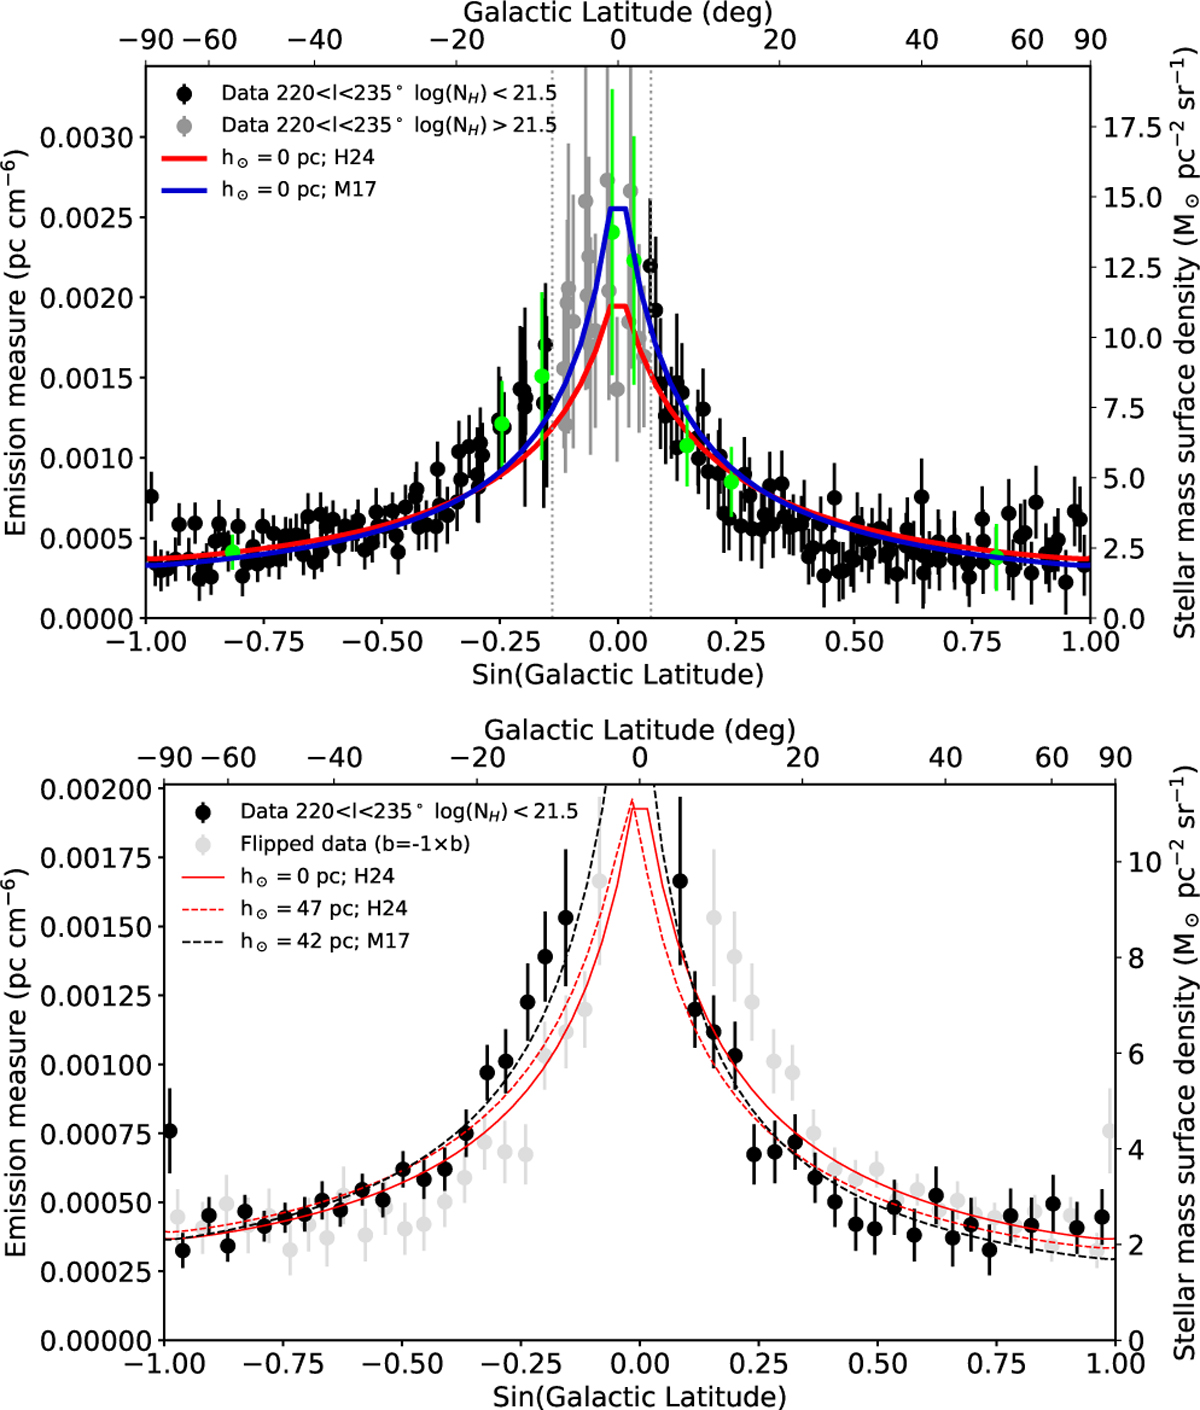
Emission measure of 0.7 keV emission for sky tiles within 220◦ < l < 235◦. Top panel: black and grey data points show the emission measure for the sky tiles with total hydrogen column density of absorption lower and higher than log(NH,HI4/cm−2) > 21.5, respectively. The red and blue curves show the best fit with the mass distribution of the Milky Way as described by Hunter et al. (2024) and McMillan (2017), respectively, assuming the Sun to lie on the Galactic plane. The right y-axis in mass surface density is valid for the Hunter et al. (2024) best-fit normalisation. The vertical dotted grey lines indicate the regions close to the Galactic disc, where the values from the HI4PI survey are in excess of log(NH,HI4/cm−2) > 21.5. The green data show the emission measure of the spectra displayed in Fig. 2. Bottom panel: black data show the same emission measures as in the top panel, re-binned over four consecutive (in Galactic latitude) sky tiles. The grey points show the same data, once the Galactic latitudes were flipped in terms of the sign (e.g. inverted northern and southern hemispheres). The solid and dashed red lines show the best-fit relation when the mass distribution is described by Hunter et al. (2024), with the Sun located on the Galactic plane and 47 pc above it, respectively. The dashed black line shows the best-fit mass distribution as described by McMillan (2017) for a height of the Sun of 42 pc above the Galactic plane. The right y-axis in mass surface density is valid for the Hunter et al. (2024) model with h⊙ = 0 best-fit normalisation.
Current usage metrics show cumulative count of Article Views (full-text article views including HTML views, PDF and ePub downloads, according to the available data) and Abstracts Views on Vision4Press platform.
Data correspond to usage on the plateform after 2015. The current usage metrics is available 48-96 hours after online publication and is updated daily on week days.
Initial download of the metrics may take a while.