Fig. 4
Download original image
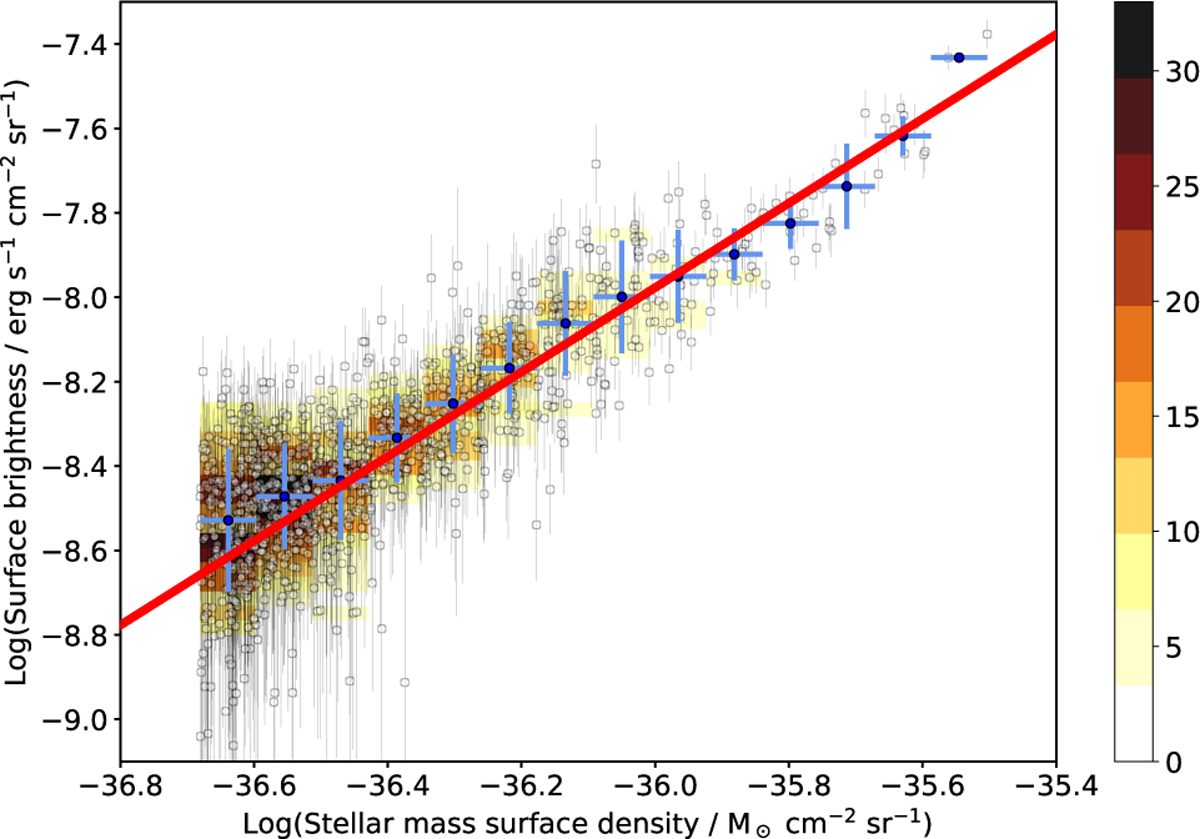
Correlation between mass distribution of the Milky Way (Hunter et al. 2024) and total surface brightness, in the 0.1–10 keV band, of the 0.7 keV component within the sky area considered in this work (one data point for each sky tile). The surface brightness was computed extrapolating the best fit 0.7 keV component to the 0.1–10 keV band, and includes all emission, i.e. point sources and diffuse emission. We rebinned the points into N bins along the x-axis, evenly spaced in log10, of the stellar mass surface density. In each bin, the dark blue dot shows the average (log10) surface brightness, while the x and y error bars show the bin’s half-width and the standard dispersion of the (log10) surface brightness in the bin, respectively. Each bin is also divided into other M sub-bins along the y-axis, with each sub-bin coloured according to the number of encompassed data points, as labelled in the colour bar on the right. The red line shows the relation between surface brightness and stellar mass surface density with Lx/M = 10.5 × 1027 erg ![]() , as derived from the fit (Table 1).
, as derived from the fit (Table 1).
Current usage metrics show cumulative count of Article Views (full-text article views including HTML views, PDF and ePub downloads, according to the available data) and Abstracts Views on Vision4Press platform.
Data correspond to usage on the plateform after 2015. The current usage metrics is available 48-96 hours after online publication and is updated daily on week days.
Initial download of the metrics may take a while.