Fig. 5
Download original image
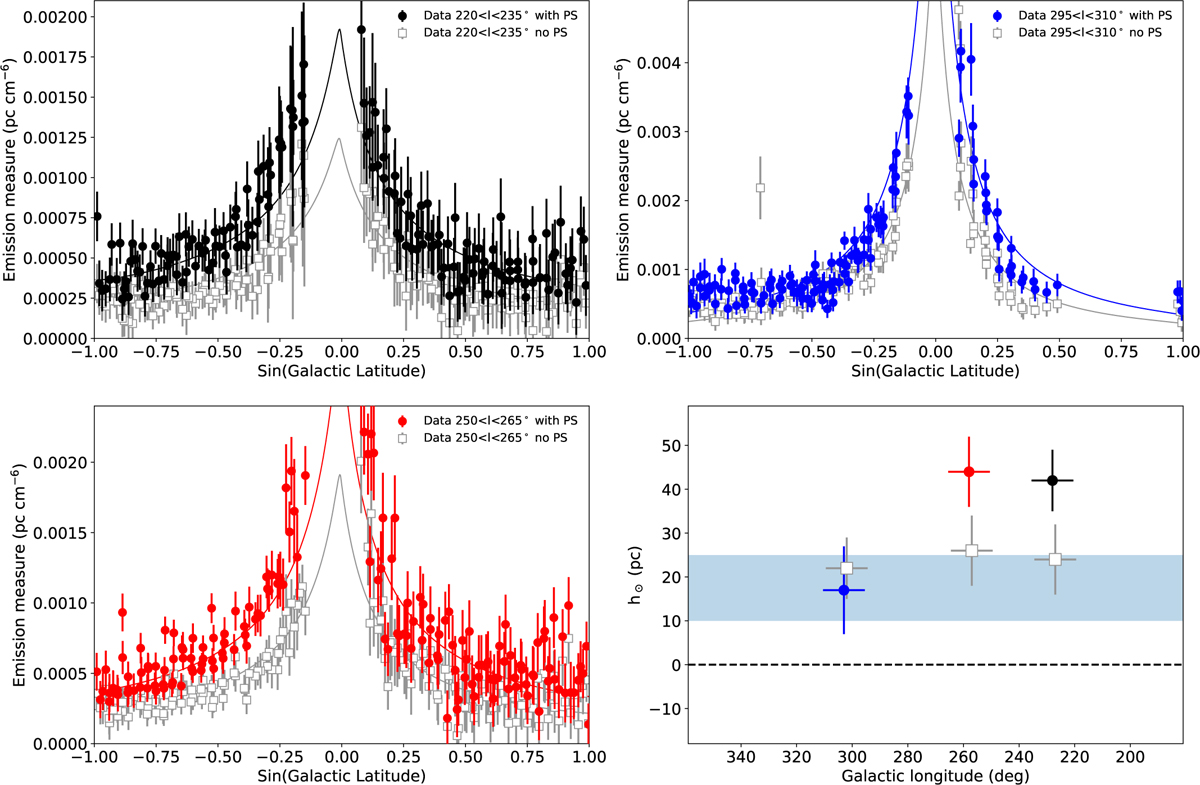
Emission measures of 0.7 keV component and its variations along three longitudinal stripes. The black, red, and blue data points show the emission measure of the 0.7 keV component within the stripes: 220◦ < l < 235◦; 250◦ < l < 265◦; and 295◦ < l < 310◦, respectively, which correspond to the same coloured dotted lines as in Fig. 1. The open grey squares show the emission measure of the 0.7 keV component along the same stripes, once the bright point sources were removed. The coloured and grey lines show the best-fit stellar surface density model (with the Hunter et al. (2024) model), which reproduces the emission measures where the bright point sources are either retained or removed, respectively. The fit was performed over the entire region considered in this work; it does not consider the addition of a beta model (see Table 1). The solid lines show the model’s prediction (at the mean longitude of each stripe), which fits the entire region selected for our analysis. Bottom right panel: best-fit position of the Sun above the Galactic plane (h⊙) as a function of the Galactic longitude derived by fitting the 0.7 keV emission measure along the same three longitudinal stripes. The filled coloured circles and the open grey squares show the best-fit offset of the Sun without and when removing the contribution from the bright point sources. The horizontal shaded blue interval shows the uncertainty on the offset of the Sun above the Galactic plane measured with other tracers (Bland-Hawthorn & Gerhard 2016; Griv et al. 2021).
Current usage metrics show cumulative count of Article Views (full-text article views including HTML views, PDF and ePub downloads, according to the available data) and Abstracts Views on Vision4Press platform.
Data correspond to usage on the plateform after 2015. The current usage metrics is available 48-96 hours after online publication and is updated daily on week days.
Initial download of the metrics may take a while.