Fig. A.1
Download original image
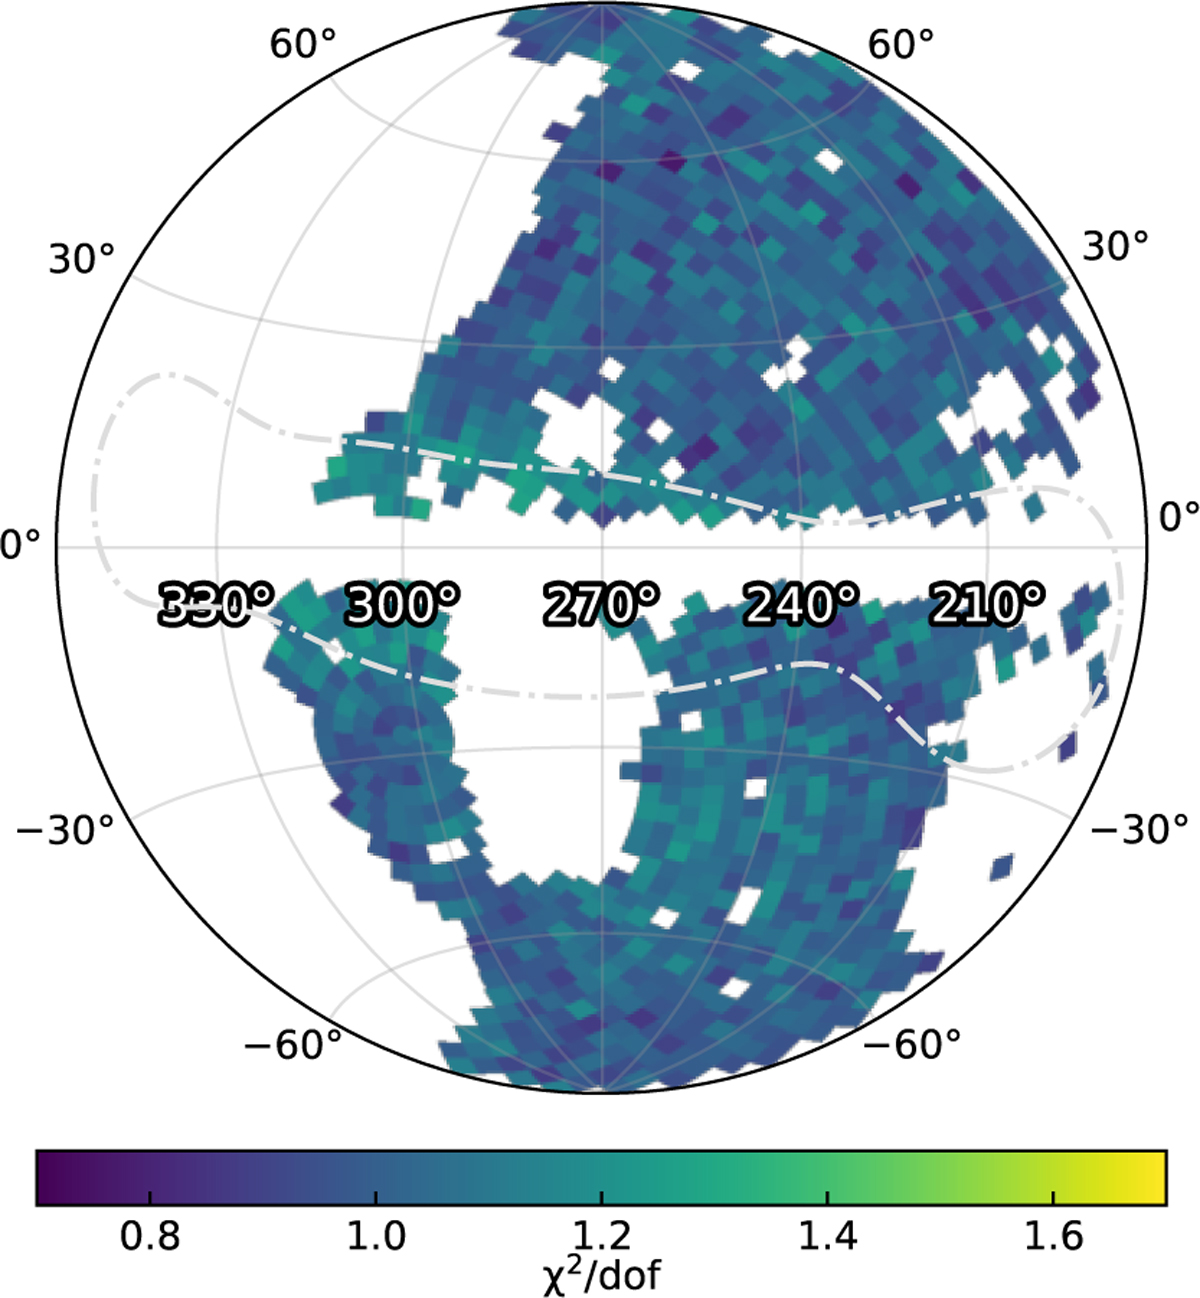
Reduced χ2 of the spectral fit for each sky tile. The white areas show the sky tiles excluded from this study. Our simplistic model can reproduce the spectra from each sky tile in a statistically acceptable way. The dot-dashed grey contours indicate the region with the highest concentration of stars within 500 pc of the Sun.
Current usage metrics show cumulative count of Article Views (full-text article views including HTML views, PDF and ePub downloads, according to the available data) and Abstracts Views on Vision4Press platform.
Data correspond to usage on the plateform after 2015. The current usage metrics is available 48-96 hours after online publication and is updated daily on week days.
Initial download of the metrics may take a while.