Fig. B.1
Download original image
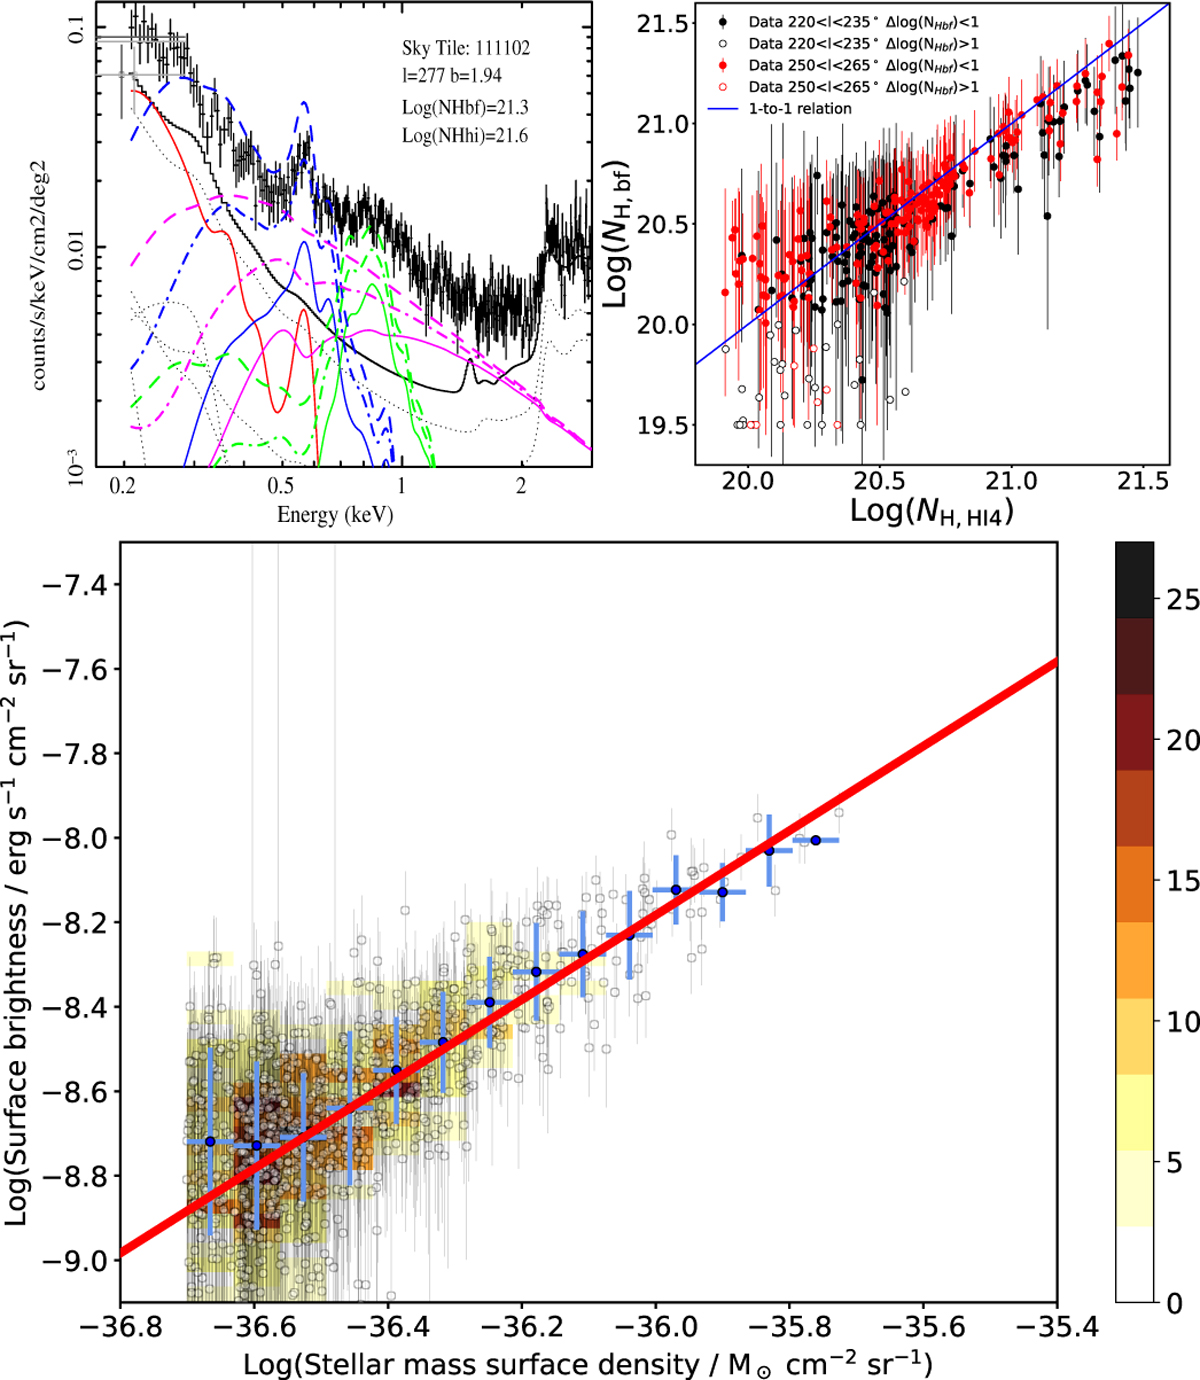
Top left panel: Best fit spectrum of the sky tile 111102, showing the effect of different column densities of absorbing material on the sky-background model. Black and grey data points show the eROSITA spectrum and the ROSAT constraints, respectively. The solid lines show the various components of the best-fit model with the FWC model in black, the unabsorbed local hot bubble in red, the warm-hot in blue, the 0.7 keV in green, and the cosmic X-ray background in magenta. This sky tile (shown in the bottom left of Fig. 2 and in green in Fig. 3) possesses a large total hydrogen column density (log(NH,HI4) = 21.6), therefore it is not considered in this work. The best fit column density of absorbing material is log(NH,bf) = 21.3. The dot-dashed and dashed lines show the same components (colour maintained) absorbed by a column density of log(NH,bf) = 21.0 and log(NH,bf) = 20.5, respectively. For column densities as large as log(NH,bf) = 21.0 or log(NH,bf) = 21.3, the presence of the low energy absorption cut off within 0.3-0.5 keV band induces a significant change on the shape and intensity of the warm-hot component. On the other hand, the shape of the 0.7 keV component is almost unaffected up to log(NH,bf) = 21.3 and its intensity drops by less than a factor of 2. Top right panel: Best fit column density of neutral absorption as a function of the total column density of Galactic absorption derived from the HI4PI survey for the single layer model. Black and red circles show the data within 220◦ < l < 235◦ and 250◦ < l < 265◦, respectively. Filled (and empty) circles indicate values which are constrained (and unconstrained; i.e., fit uncertainty larger 1 dex) by the fit. The blue line shows the one-to-one correlation. Bottom panel: Correlation between the mass distribution of the Milky Way (Hunter et al. 2024) and the surface brightness as in Fig. 4, for sky tiles with log(NH,HI4) < 21.0, once the bright point sources have been excised. The best fit correlation (red line) aligns with the previous results, confirming that absorption has a minimal effect.
Current usage metrics show cumulative count of Article Views (full-text article views including HTML views, PDF and ePub downloads, according to the available data) and Abstracts Views on Vision4Press platform.
Data correspond to usage on the plateform after 2015. The current usage metrics is available 48-96 hours after online publication and is updated daily on week days.
Initial download of the metrics may take a while.