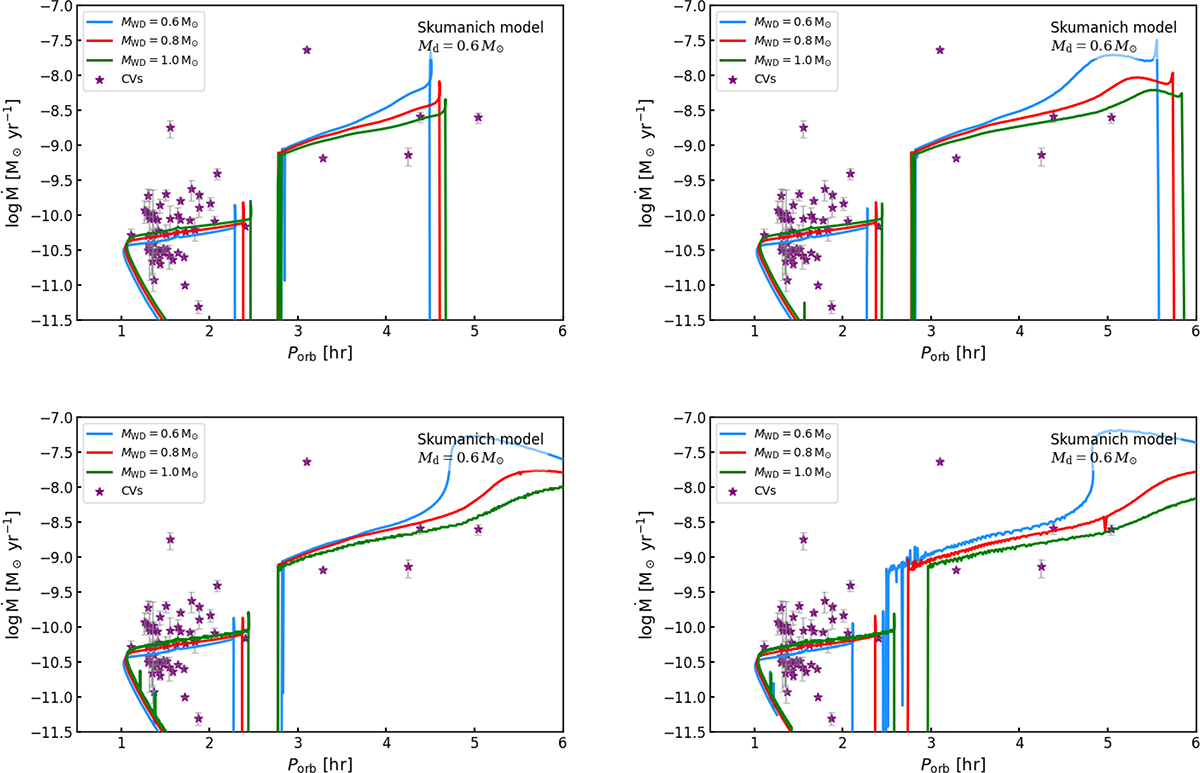
Fig. 1.
Download original image
Evolutional tracks of the Skumanich model: mass-transfer rate as a function of orbital period for different donor masses–0.6 M⊙ (top left), 0.8 M⊙ (top right), 1.0 M⊙ (bottom left), and 1.2 M⊙ (bottom right). Each panel shows the evolutionary tracks for three different WD masses: 0.6 M⊙ (blue), 0.8 M⊙ (red), and 1.0 M⊙ (green). The purple pentagrams denote observational data obtained from Pala et al. (2020, 2022), and Sarkar et al. (2024), as well as the additional sources listed in Table A.1. All systems are initialized at an orbital period of 0.4 day.
Current usage metrics show cumulative count of Article Views (full-text article views including HTML views, PDF and ePub downloads, according to the available data) and Abstracts Views on Vision4Press platform.
Data correspond to usage on the plateform after 2015. The current usage metrics is available 48-96 hours after online publication and is updated daily on week days.
Initial download of the metrics may take a while.