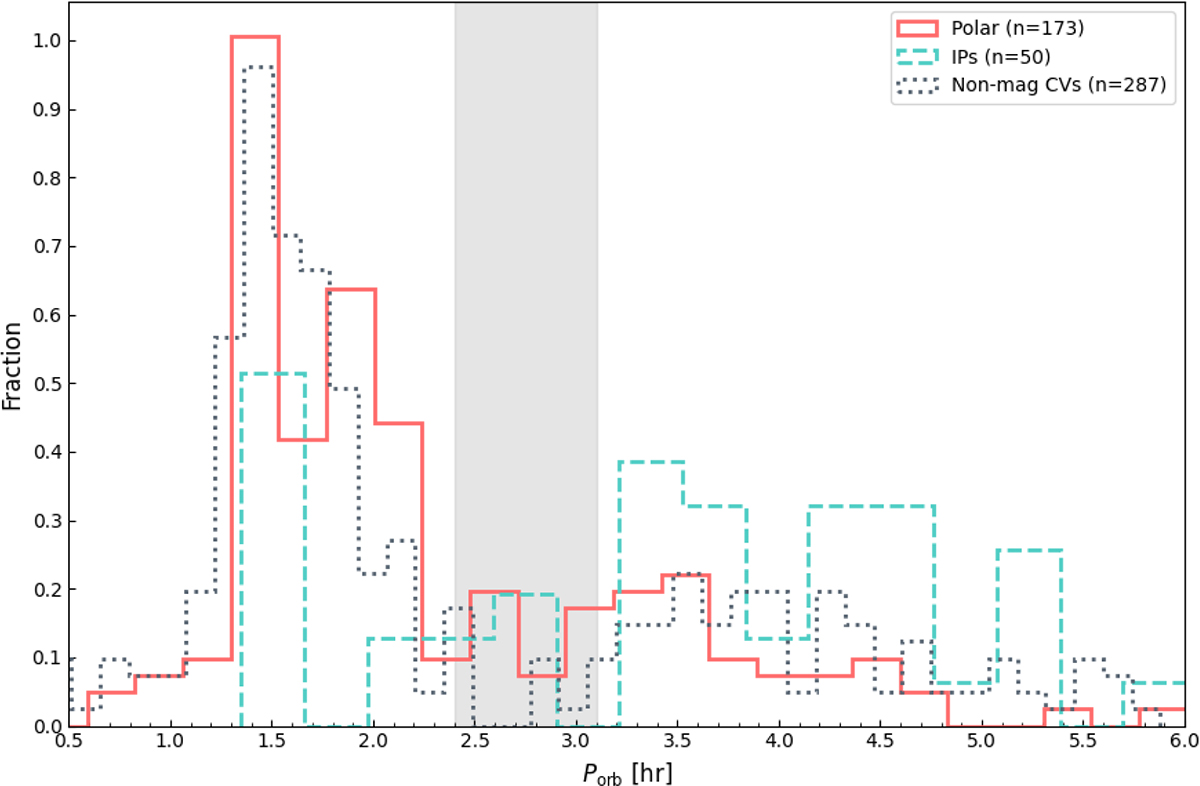
Fig. 13.
Download original image
Normalized orbital period distributions for different classes of CVs. Polar systems are represented by solid red lines, IPs by dashed teal lines, and nonmagnetic systems by dotted gray lines. Data were compiled from Norton et al. (2004), Ferrario et al. (2015), Parsons et al. (2021), Hakala et al. (2022), van Roestel et al. (2025), Sparks & Sion (2021), and Schreiber et al. (2024). The gray shaded region indicates the period gap proposed by Schreiber et al. (2024). The numbers shown in the legend (n) denote the number of systems in each subclass.
Current usage metrics show cumulative count of Article Views (full-text article views including HTML views, PDF and ePub downloads, according to the available data) and Abstracts Views on Vision4Press platform.
Data correspond to usage on the plateform after 2015. The current usage metrics is available 48-96 hours after online publication and is updated daily on week days.
Initial download of the metrics may take a while.