Fig. 6.
Download original image
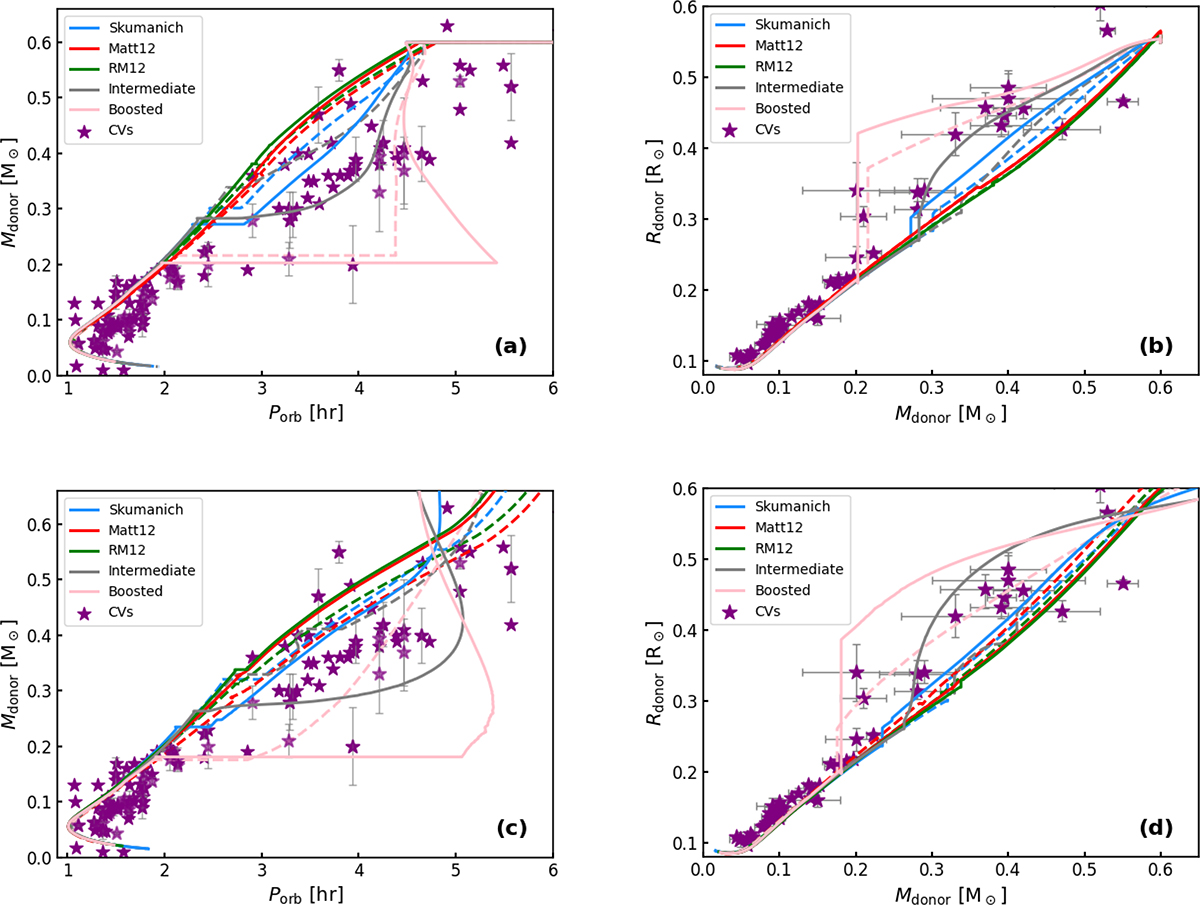
Evolutionary diagrams comparing orbital period (Porb) and donor star properties for five MB prescriptions. Left panels: Relationship between Porb and donor mass (Mdonor). Right panels: Corresponding donor radius (Rdonor) versus mass evolution. In panels (a) and (b), we show Mdonor, i = 0.6 M⊙ + MWD, i = 0.6 M⊙ (solid lines) and Mdonor, i = 0.6 M⊙ + MWD, i = 1.0 M⊙ (dashed). (b) In panels (c) and (d) we show Mdonor, i = 1.2 M⊙ + MWD, i = 0.6 M⊙ (solid) and Mdonor, i = 1.2 M⊙ + MWD, i = 1.0 M⊙ (dashed). All models share initial orbital period Porb, i = 0.4 d. Observed systems from McAllister et al. (2019) are marked with purple stars.
Current usage metrics show cumulative count of Article Views (full-text article views including HTML views, PDF and ePub downloads, according to the available data) and Abstracts Views on Vision4Press platform.
Data correspond to usage on the plateform after 2015. The current usage metrics is available 48-96 hours after online publication and is updated daily on week days.
Initial download of the metrics may take a while.