Open Access
Fig. 9.
Download original image
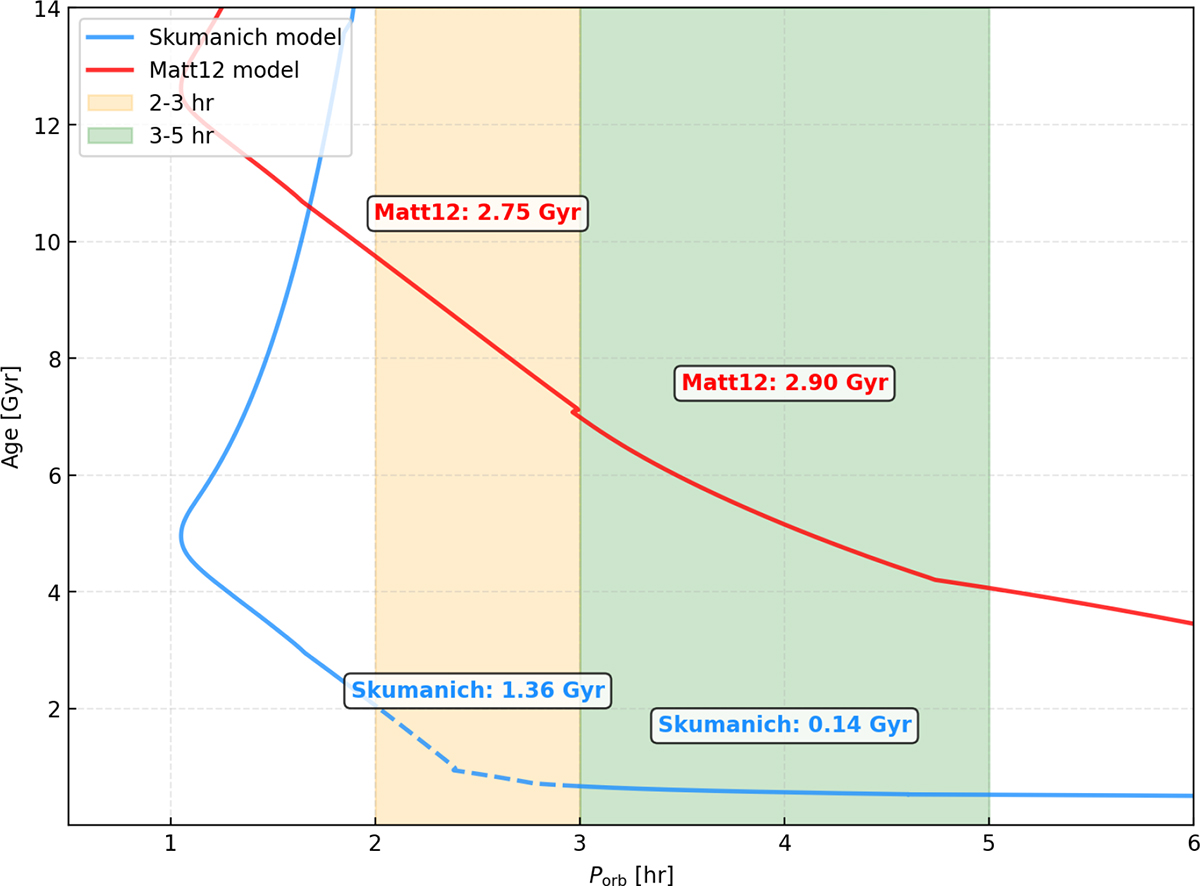
Orbital period versus timescale relationships for the Skumanich (blue) and Matt12 (red) models. The solid lines represent their respective evolutionary tracks. The timescales experienced during evolution in the orbital period ranges of 2–3 hours and 3–5 hours are labeled for both models.
Current usage metrics show cumulative count of Article Views (full-text article views including HTML views, PDF and ePub downloads, according to the available data) and Abstracts Views on Vision4Press platform.
Data correspond to usage on the plateform after 2015. The current usage metrics is available 48-96 hours after online publication and is updated daily on week days.
Initial download of the metrics may take a while.