Fig. 5.
Download original image
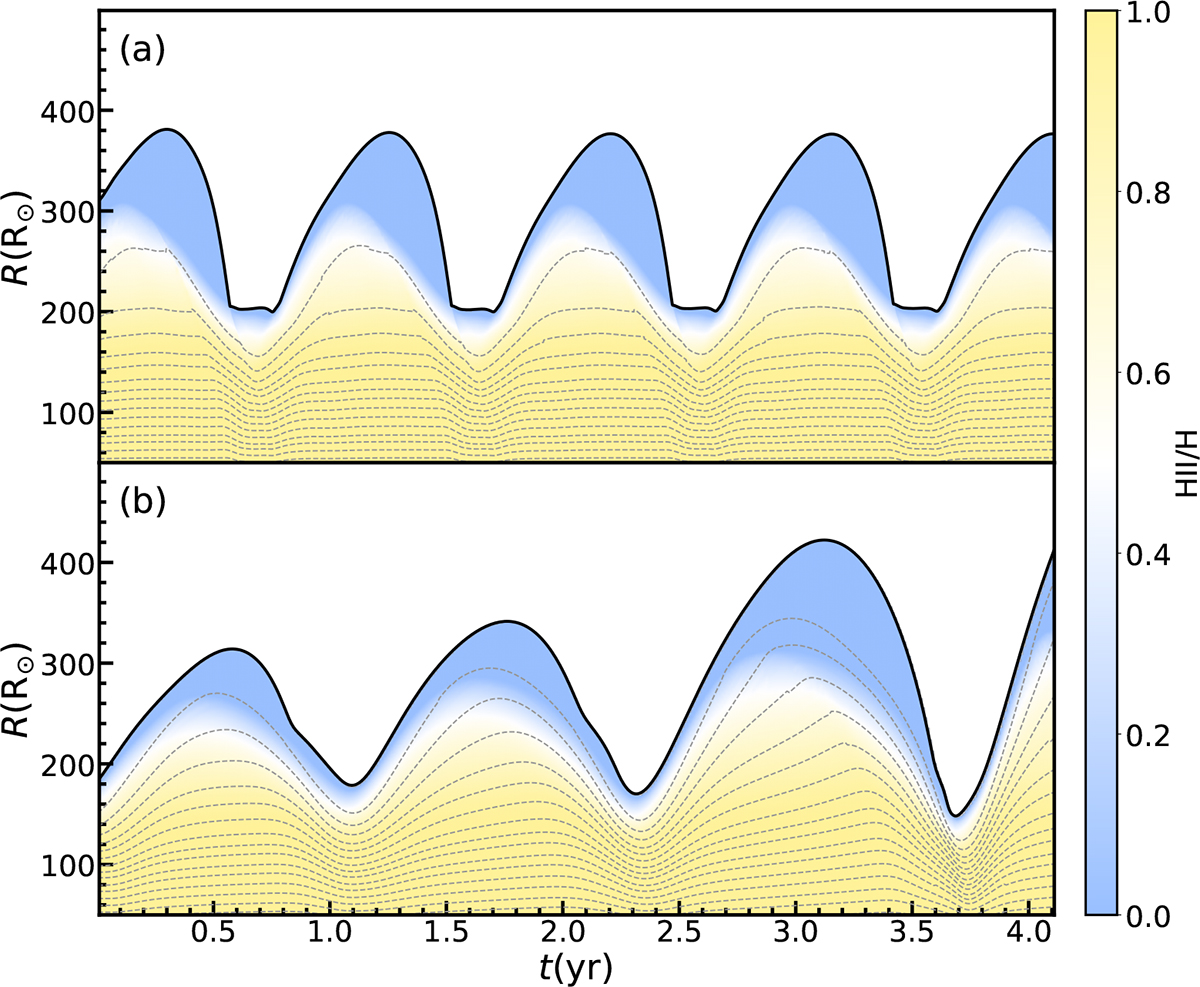
Evolution of the envelope structure during the first four years after the onset of the dynamical simulation. Panels (a) and (b) show models with envelope masses of 0.64 M⊙ and 0.25 M⊙, respectively. The solid black line indicates the stellar radius, while the dashed gray lines mark the radial positions that divide the envelope mass into 20 equal parts. The color bar represents the relative fraction of ionized hydrogen.
Current usage metrics show cumulative count of Article Views (full-text article views including HTML views, PDF and ePub downloads, according to the available data) and Abstracts Views on Vision4Press platform.
Data correspond to usage on the plateform after 2015. The current usage metrics is available 48-96 hours after online publication and is updated daily on week days.
Initial download of the metrics may take a while.