Fig. 4.
Download original image
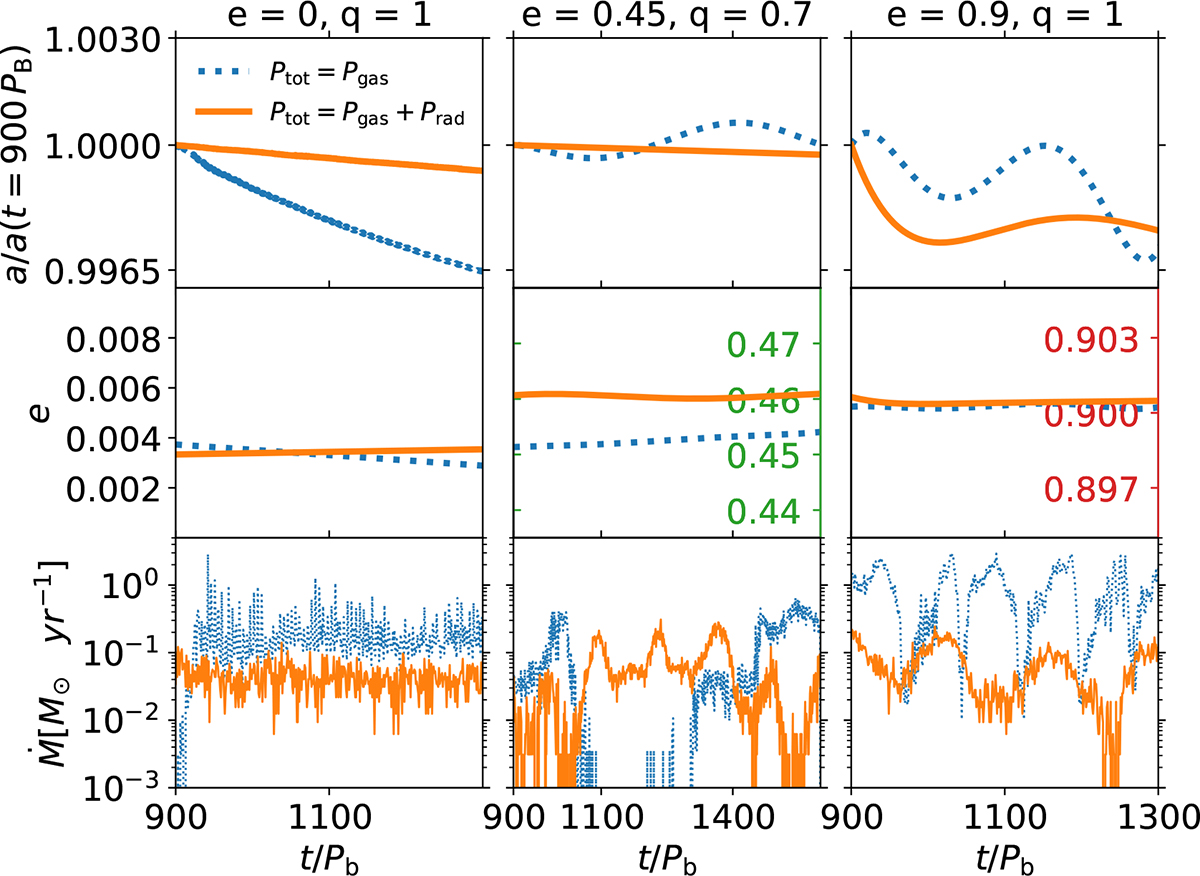
Time evolution of the semi-major axis (top panel), eccentricity (centre panel), and accretion rate (bottom panel) over the last 400 orbital periods for the binary case e = 0, q = 1 (first column) and e = 0.9, q = 1 (last column) and over the last 700 orbital periods for the binary case e = 0.45, q = 0.7 (central column). The orange and the blue lines refer to the simulation with and without the radiation pressure contribution, respectively. The semi-major axis has been normalised to set a(t = 900 PB) = 1 since this is the point where our binaries start to accrete material.
Current usage metrics show cumulative count of Article Views (full-text article views including HTML views, PDF and ePub downloads, according to the available data) and Abstracts Views on Vision4Press platform.
Data correspond to usage on the plateform after 2015. The current usage metrics is available 48-96 hours after online publication and is updated daily on week days.
Initial download of the metrics may take a while.