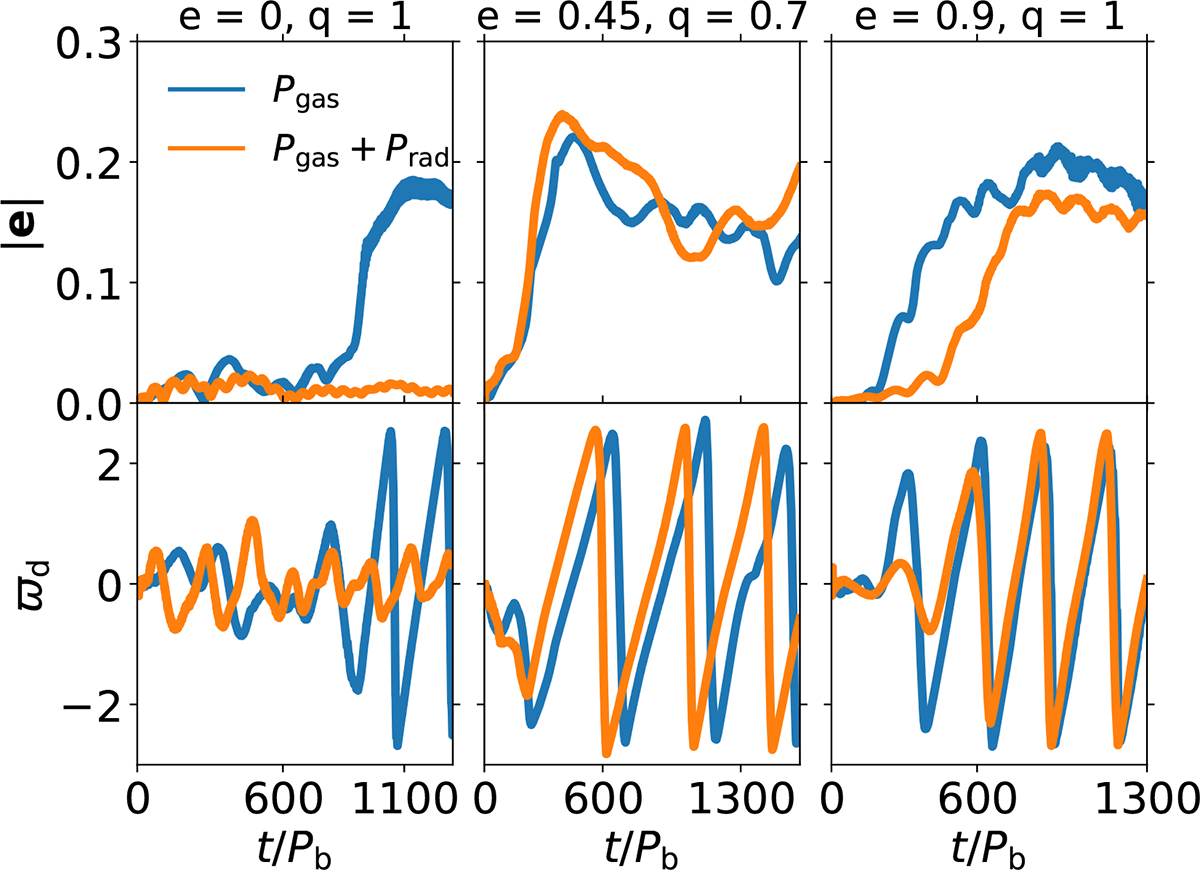
Fig. 5.
Download original image
Eccentricity vector evolution over time for the simulations with e = 0, q = 1 binaries (left column); e = 0.45, q = 0.7 binaries (centre column); and e = 0.9, q = 1 binaries (right column). The top panels show the magnitude, and the bottom panels show the phase in radians. The orange and blue lines refer to the simulation with and without the radiation pressure contribution, respectively.
Current usage metrics show cumulative count of Article Views (full-text article views including HTML views, PDF and ePub downloads, according to the available data) and Abstracts Views on Vision4Press platform.
Data correspond to usage on the plateform after 2015. The current usage metrics is available 48-96 hours after online publication and is updated daily on week days.
Initial download of the metrics may take a while.