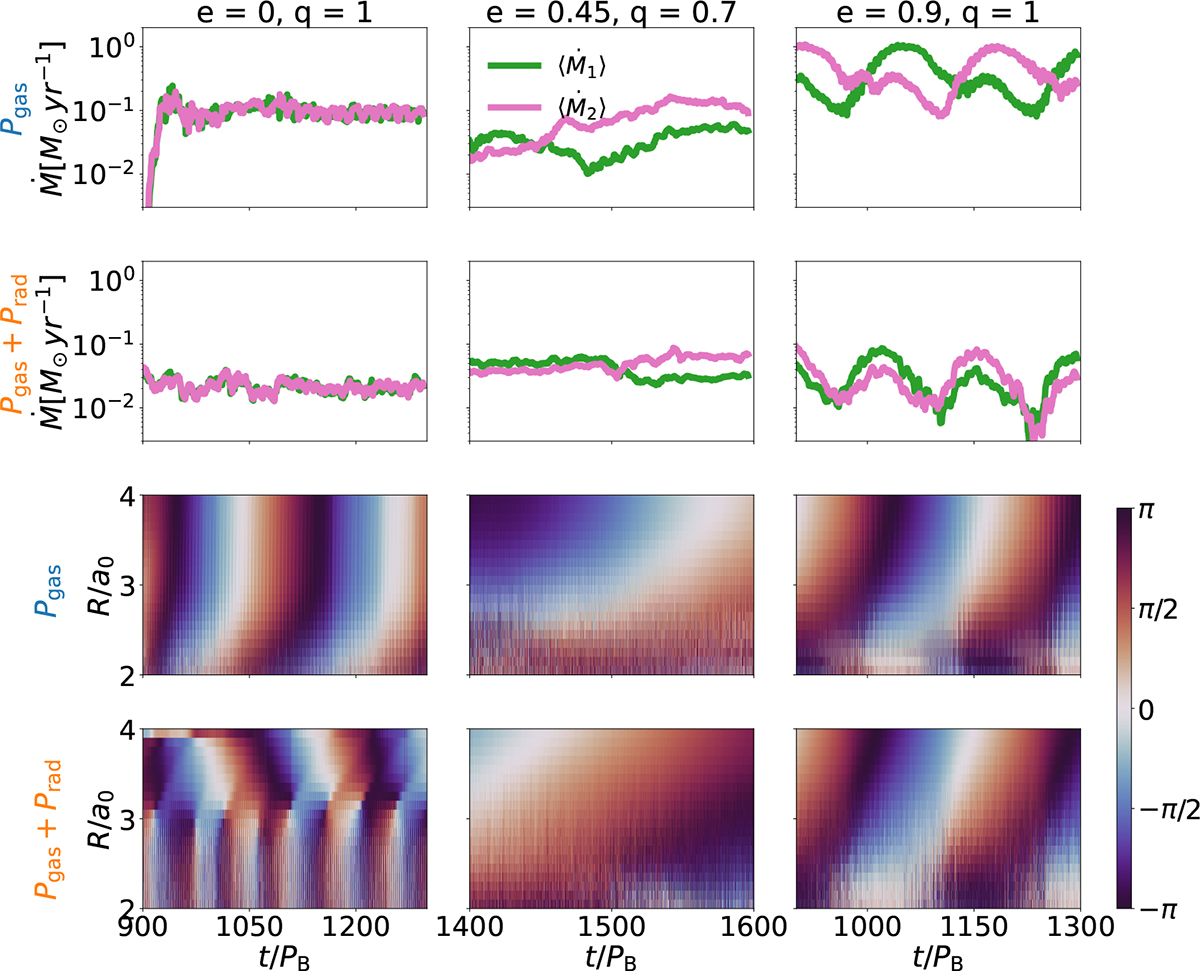
Fig. 6.
Download original image
Time evolution of the individual accretion rate (first and second row) and the relative precession phase between the disc and the binary (ϖ = ϖd − ϖb; third and last row) for the equal mass circular case e = 0, q = 1 (left column); e = 0.45, q = 0.7 (middle column); and the equal mass highly eccentric one e = 0.9, q = 1 (right column). The first two rows show the accretion onto the primary (green line) and the secondary (pink line) black hole over the last 400 and 200 orbits for the equal and unequal mass cases, respectively. The upper row shows the results of simulations without the radiation pressure, while the second row includes the radiation pressure. The third and last row display the evolution of the relative precession phase over the radius. The third row shows results without radiation pressure, and the last row includes it.
Current usage metrics show cumulative count of Article Views (full-text article views including HTML views, PDF and ePub downloads, according to the available data) and Abstracts Views on Vision4Press platform.
Data correspond to usage on the plateform after 2015. The current usage metrics is available 48-96 hours after online publication and is updated daily on week days.
Initial download of the metrics may take a while.